China Energy Crisis drives electricity shortages, power cuts, and blackouts as coal prices surge, carbon-neutrality rules tighten, and manufacturing hubs ration energy, disrupting supply chains and industrial output ahead of winter demand peaks.
Key Points
A power shortfall from costly coal, price caps, and emissions targets, causing blackouts and industrial rationing.
✅ Coal prices soar while electricity tariffs are capped
✅ Factories in northeast hubs face rationing and downtime
✅ Supply chains risk delays ahead of winter demand
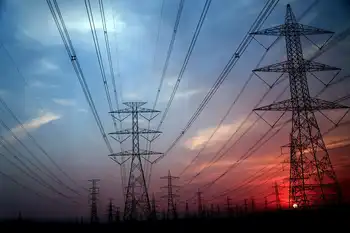
China is struggling with a severe shortage of electricity which has left millions of homes and businesses hit by power cuts.
Blackouts are not that unusual in the country but this year a number of factors have contributed to a perfect storm for electricity suppliers, including surging electricity demand globally.
The problem is particularly serious in China's north eastern industrial hubs as winter approaches - and is something that could have implications for the rest of the world.
Why has China been hit by power shortages?
The country has in the past struggled to balance electricity supplies with demand, which has often left many of China's provinces at risk of power outages.
During times of peak power consumption in the summer and winter the problem becomes particularly acute.
But this year a number of factors have come together to make the issue especially serious.
As the world starts to reopen after the pandemic, demand for Chinese goods is surging and the factories making them need a lot more power, highlighting China's electricity appetite in recent months.
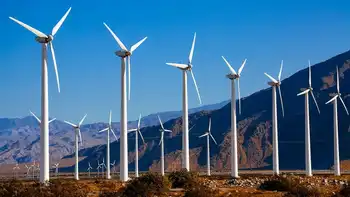
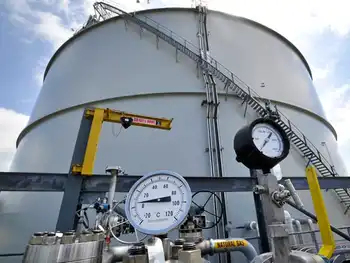
Rules imposed by Beijing as it attempts to make the country carbon neutral by 2060 have seen coal production slow, even as the country still relies on coal for more than half of its power and as low-emissions generation is set to cover most global demand growth.
And as electricity demand has risen, the price of coal has been pushed up.
But with the government strictly controlling electricity prices, coal-fired power plants are unwilling to operate at a loss, with many drastically reducing their output instead.
Who is being affected by the blackouts?
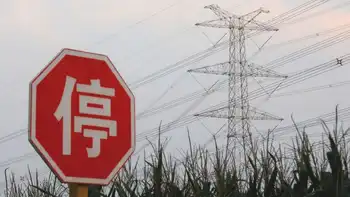
Homes and businesses have been affected by power cuts as electricity has been rationed in several provinces and regions.
A coal-burning power plant can be seen behind a factory in China"s Inner Mongolia Autonomous Region
The state-run Global Times newspaper said there had been outages in four provinces - Guangdong in the south and Heilongjiang, Jilin and Liaoning in the north east. There are also reports of power cuts in other parts of the country.
Companies in major manufacturing areas have been called on to reduce energy usage during periods of peak demand or limit the number of days that they operate.
Energy-intensive industries such as steel-making, aluminium smelting, cement manufacturing and fertiliser production are among the businesses hardest hit by the outages.
What has the impact been on China's economy?
Official figures have shown that in September 2021, Chinese factory activity shrunk to the lowest it had been since February 2020, when power demand dropped as coronavirus lockdowns crippled the economy.
Concerns over the power cuts have contributed to global investment banks cutting their forecasts for the country's economic growth.
Goldman Sachs has estimated that as much as 44% of the country's industrial activity has been affected by power shortages. It now expects the world's second largest economy to expand by 7.8% this year, down from its previous prediction of 8.2%.
Globally, the outages could affect supply chains, including solar supply chains as the end-of-the-year shopping season approaches.
Since economies have reopened, retailers around the world have already been facing widespread disruption amid a surge in demand for imports.
China's economic planner, the National Development and Reform Commission (NDRC), has outlined a number of measures to resolve the problem, with energy supplies in the northeast of the country as its main priority this winter.
The measures include working closely with generating firms to increase output, ensuring full supplies of coal and promoting the rationing of electricity.
The China Electricity Council, which represents generating firms, has also said that coal-fired power companies were now "expanding their procurement channels at any cost" in order to guarantee winter heat and electricity supplies.
However, finding new sources of coal imports may not be straightforward.
Russia is already focused on its customers in Europe, Indonesian output has been hit by heavy rains and nearby Mongolia is facing a shortage of road haulage capacity,
Are energy shortages around the world connected?
Power cuts in China, UK petrol stations running out of fuel, energy bills jumping in Europe, near-blackouts in Japan and soaring crude oil, natural gas and coal prices on wholesale markets - it would be tempting to assume the world is suddenly in the grip of a global energy drought.
However, it is not quite as simple as that - there are some distinctly different issues around the world.
For example, in the UK petrol stations have run dry as motorists rushed to fill up their vehicles over concerns that a shortage of tanker drivers would mean fuel would soon become scarce.
Meanwhile, mainland Europe's rising energy bills and record electricity prices are due to a number of local factors, including low stockpiles of natural gas, weak output from the region's windmills and solar farms and maintenance work that has put generating operations out of action.
Related News