Manitoba Electrification History charts arc lights, hydroelectric dams, Winnipeg utilities, transmission lines, rural electrification, and Manitoba Hydro to today's wind, solar, and EV transition across the provincial power grid, driving modernization and reliability.
Key Points
Manitoba's power evolution from arc lights to hydro and rural electrification, advancing wind and solar on a modern grid.
✅ 1873 Winnipeg arc light predates Edison and Bell.
✅ 1919 Act built transmission lines, rural electrification.
✅ Hydroelectric dams reshaped lands and affected First Nations.
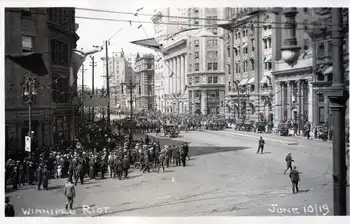
The first electric light in Manitoba was turned on in Winnipeg in 1873, but it was a century ago this year that the switch was flipped on a decision that would bring power to the fingertips of people across the province.
On March 12, 1873, Robert Davis — who owned the Davis House hotel on Main Street, about a block from Portage Avenue — used an electric arc light to illuminate the front of his building, according to A History of Electric Power in Manitoba, published by Manitoba Hydro.
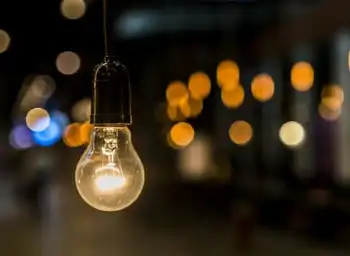
That type of light used an an inert gas in a glass container to create an electric arc between two metal electrodes.
"The lamp in front of the Davis Hotel is quite an institution," a Manitoba Free Press report from the day said. "It looks well and guides the weary traveller to a haven of rest, billiards and hot drinks."
A ladder crew from the Winnipeg Electric Street Railway Company working on an electric trolley line in 1905. (I.F. Allen/Manitoba Hydro archives)
The event took place six years before Thomas Edison's first incandescent lamp was invented and three years before the first complete sentence was spoken over the telephone by Alexander Graham Bell.
"Electrification probably had a bigger influence on the lives of Manitobans than virtually anything else," said Gordon Goldsborough, head researcher with the Manitoba Historical Society.
"It's one of the most significant changes in the lives of Manitobans ever, because basically it transformed so many aspects of their lives. It wasn't just one thing — it touched pretty much every aspect of life."
Winnipeg gets its 1st street lamps
In the pioneer days of lighting and street railway transportation in Winnipeg, multiple companies formed in an effort to take advantage of the new utility: Winnipeg Gas Company, Winnipeg General Power Company, Manitoba Electric and Gas Light Company, and The North West Electric Light and Power Company.
In October 1882, the first four street lamps, using electric arc lights, were turned on along Main Street from Broadway to the CPR crossing over the Assiniboine River.
They were installed privately by P.V. Carroll, who came from New York to establish the Manitoba Electric Light & Power Company and try to win a contract for illuminating the rest of the city's streets.
He didn't get it. Newspaper reports from the time noted many outages and other problems and general disappointment in the quality of the light.
Instead, the North West Electric Light and Power Company won that contract and in June 1883 it lit up the streets.
Workers erect a wooden hydro pole beside the Belmont Hotel in 1936. Belmont is a small community southeast of Brandon. (Manitoba Hydro archives)
Over the years, other companies would bring power to the city as it became more reliable, including the Winnipeg Electric Street Railway Company (WERCo), which built the streetcar system and sold electric heat, light and power.
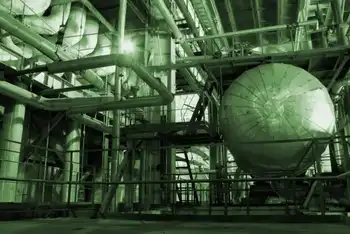
But it was the Brandon Electric Light Company that first tapped into a new source of power — hydro. In 1900, a dam was built across the Minnedosa River (now known as the Little Saskatchewan River) in western Manitoba, and the province's first hydroelectric generating station was created.
The first transmission line was also built, connecting the station with Brandon.
By 1906, WERCo had taken over the Winnipeg General Power Company and the Manitoba Electric and Gas Light Company, and changed its name to the Winnipeg Electric Railway Company. Later, it became the Winnipeg Electric Company, or WECo.
It also took a cue from Brandon, building a hydroelectric plant to provide more power. The Pinawa dam site operated until 1951 and is now a provincial park.
The Minnedosa River plant was the first hydroelectric generating station in Manitoba. (Manitoba Hydro archives)
The City of Winnipeg Hydroelectric System was also formed in 1906 as a public utility to combat the growing power monopoly held by WECo, and to get cheaper power. The city had been buying its supply from the private company "and the City of Winnipeg didn't quite like that price," said Bruce Owen, spokesman for Manitoba Hydro.
So the city funded and built its own dam and generating station site on the Winnipeg River in Pointe du Bois — about 125 kilometres northeast of Winnipeg — which is still in operation today.
"All of a sudden, not only did we have street lights … businesses had lights, power was supplied to homes, people no longer had to cook on wood stoves or walk around with kerosene lanterns. This city took off," said Owen.
"It helped industry grow in the city of Winnipeg. Within a few short years, a second plant had to be built, at Slave Falls."
Lighting up rural Manitoba
While the province's two biggest cities enjoyed the luxury of electricity and the conveniences it brought, the patchwork of power suppliers had also created a jumble of contracts with differing rates and terms, spurring periodic calls for a western Canadian electricity grid to improve coordination.
Meanwhile, most of rural Manitoba remained in the dark.
The Pinawa Dam was built by the Winnipeg Electric Street Railway Company in 1906 and operated until 1951. (Manitoba Hydro archives)
The Pinawa Dam site now, looking like some old Roman ruins. (Darren Bernhardt/CBC)
That began to change in 1919 when the Manitoba government passed the Electric Power Transmission Act, with the aim of supplying rural Manitoba with electrical power. The act enabled the construction of transmission lines to carry electricity from the Winnipeg River generating stations to communities all over southern Manitoba.
It also created the Manitoba Power Commission, predecessor to today's Manitoba Hydro, to purchase power from the City of Winnipeg — and later WECo — to supply to those other communities.
The first transmission line, a 97-kilometre link between Winnipeg and Portage la Prairie, opened in late 1919, and modern interprovincial projects like Manitoba-Saskatchewan power line funding continue that legacy today. The power came from Pointe du Bois to a Winnipeg converter station that still stands at the corner of Stafford Street and Scotland Avenue, then went on to Portage la Prairie.
"That's the remarkable thing that started in 1919," said Goldsborough.
Every year after that, the list of towns connected to the power grid became longer "and gradually, over the early 20th century, the province became electrified," Goldsborough said.
"You'd see these maps that would spider out across the province showing the [lines] that connected each of these communities — a precursor to ideas like macrogrids — to each other, and it was really quite remarkable."
By 1928, 33 towns were connected to the Manitoba Power Commission grid. That rose to 44 by 1930 and 140 by 1939, according to the Manitoba Historical Society.
Power on the farm
Still, one group who could greatly use electricity for their operations — farmers — were still using lanterns, steam and coal for light, heat and power.
"The power that came to the [nearest] town didn't extend to them," said Goldsborough.
It was during the Second World War, as manual labour was hard to come by on farms, that the Manitoba Power Commission recognized the gap in its grid.
It met with farmers to explain the benefits electricity could bring and surveyed their interest. When the war ended in 1945, the farm electrification process got underway.
Employees, their spouses, and children pose for a photo outside of Great Falls generating station in 1923. (Manitoba Hydro archives)
Farmers were taught wiring techniques and about the use of motors for farm equipment, as well as about electric appliances and other devices to ease the burden of domestic life.
"The electrification of the 1940s and '50s absolutely revolutionized rural life," said Goldsborough.
"Farmers had to provide water for all those animals and in a lot of cases [prior to electrification] they would just use a hand pump, or sometimes they'd have a windmill. But these were devices that weren't especially reliable and they weren't high capacity."
Electric motors changed everything, from pumping water to handling grain, while electric heat provided comfort to both people and animals.
Workers build a hydro transmission line tower in an undated photo from Manitoba Hydro. (Manitoba Hydro archives)
"Now you could have heat lamps for your baby chickens. They would lose a lot of chickens normally, because they would simply be too cold," Goldsborough said.
Keeping things warm was important, but so too was refrigeration. In addition to being able to store meat in summer, it was "something to prolong the life of dairy products, eggs, anything," said Manitoba Hydro's Owen.
"It's all the things we take for granted — a flick of a switch to turn the lights on instead of walking around with a lantern, being able to have maybe a bit longer day to do routine work because you have light."
Agriculture was the backbone of the province but it was limited without electricity, said Owen.
Connecting it to the grid "brought it into the modern age and truly kick-started it to make it a viable part of our economy," he said. "And we still see that today."
In 1954, when the farm electrification program ended, Manitoba was the most wired of the western provinces, with 75 per cent of farms and 100,000 customers connected.
The success of the farm electrification program, combined with the post-war boom, brought new challenges, as the existing power generation could not support the new demand.
The three largest players — City Hydro, WECo and the Manitoba Power Commission, along with the provincial government — created the Manitoba Hydro-Electric Board in 1949 to co-ordinate generation and distribution of power.
A float in a Second World War victory parade represents a hydroelectric dam and the electricity it generates to power cities. (Manitoba Hydro archives)
More hydroelectric generating stations were built and more reorganizations took place. WECo was absorbed by the board and its assets split into separate companies — Greater Winnipeg Gas and Greater Winnipeg Transit.
Its electricity distribution properties were sold to City Hydro, which became the sole distributor in central Winnipeg. The Manitoba Power Commission became sole distributor of electricity in the suburbs and the rest of Manitoba.
Impacts on First Nations
Even as the lives of many people in the province were made easier by the supply of electricity, many others suffered from negative impacts in the rush of progress.
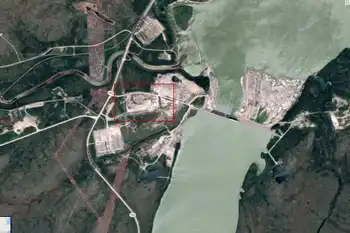
Many First Nations were displaced by hydro dams, which flooded their ancestral lands and destroyed their traditional ways of life.
"And we hear stories about the potential abuses that occurred," said Goldsborough. "So you know, there are there pluses but there are definitely minuses."
In the late 1950s, the Manitoba Power Commission continued to grow and expand its reach, this time moving into the north by buying up private utilities in The Pas and Cranberry Portage.
In 1961, the provincial government merged the commission with the Manitoba Hydro-Electric Board to create Manitoba Hydro.
In 1973, 100 years after the first light went on at that Main Street hotel, the last of the independent power utilities in the province — the Northern Manitoba Power Company Ltd. — was taken over by Hydro.
Winnipeg Hydro, previously called City Hydro, joined the fold in 2002.
Today, Manitoba Hydro operates 15 generating stations and serves 580,262 electric power customers in the province, as well as 281,990 natural gas customers.
New era
And now, as happened in 1919, a new era in electricity distribution is emerging as alternative sources of power — wind and solar — grow in popularity, and as communities like Fort Frances explore integrated microgrids for resilience.
"There's a bit of a clean energy shift happening," said Owen, adding use of biomass energy — energy production from plant or animal material — is also expanding.
"And there's a technological change going on and that's the electrification of vehicles. There are only really several hundred [electric vehicles] in Manitoba on the streets right now. But we know at some point, with affordability and reliability, there'll be a switch over and the gas-powered internal combustion engine will start to disappear."
'We're just a little behind here': Manitoba electric vehicle owners call for more charging stations
That means electrical utilities around the world are re-examining their capabilities, as climate change increasingly stresses grids, said Owen.
"It's coming [and we need to know], are we in a position to meet it? What will be the demands on the system on a path to a net-zero grid by 2050 nationwide?" he said.
"It may not come in my lifetime, but it is coming."
Related News