Solar will make the grid harder to run

By SignOn San Diego


Protective Relay Training - Basic

Our customized live online or in‑person group training can be delivered to your staff at your location.

  • Live Online
  • 12 hours Instructor-led
  • Group Training Available
Regular Price:
$699
Coupon Price:
$599
Reserve Your Seat Today
The electric grid wasn't designed for a million solar roofs.

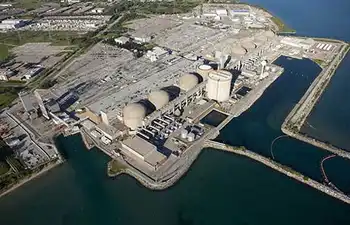
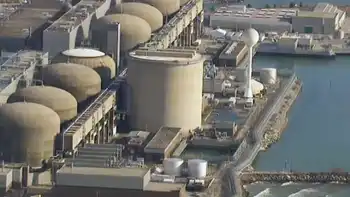
It was designed to work with big power plants, substations and wires leading to every house and business and for the power in those wires to flow from the generation plant to the customer.

But what happens when the customer is the generation plant? And what happens when there are tens of thousands of solar panels out there?

Power then flows both ways, affecting the amount and quality of electricity. As more and more solar panels are installed, the possible headaches for those who run the grid grows.

But the industry is working on it.

"There are tons of researchers working on this stuff," said Molly Sterkel, who oversees the state's solar subsidy program.

Along with the federal Department of Energy, Sterkel's agency, the California Public Utilities Commission brought together dozens of researchers, utility officials and solar company executives to La Jolla.

The goal of the two-day meeting at the Scripps Institution of Oceanography is to figure out how the electric grid can best handle the addition of lots of solar panels.

The PUC is spending $50 million over several years on the research. The Department of Energy is putting $42 million this fiscal year.

With the number of solar installations increasing, the impacts will grow.

More than 77 percent of San Diego Gas & Electric's circuits have solar panels on them.

By 2020, there will be times of the day when some San Diego neighborhoods will produce more power than they use, said Tom Bialek, chief engineer of smart grid for SDG&E.

The problem isn't in the middle of the summer, when the panels are making lots of power and people are using electricity for air conditioning.

It's at times like April, when the sun shines brightly, but the temperature is comfortable, and the solar power can become a big chunk of the power on the grid.

Partly cloudy days are particularly problematic, Bialek said.

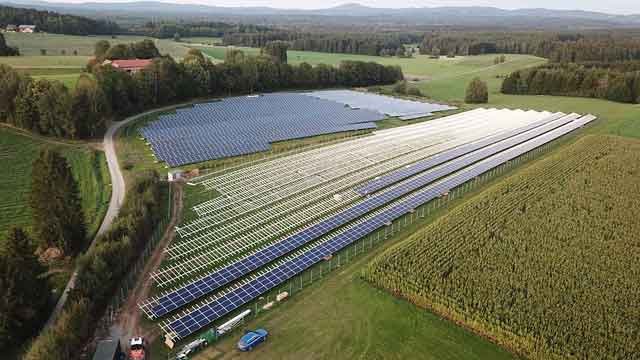
For example, he described how a single large installation in the county, a one-megawatt array, fluctuated from making 700 kilowatts to making nothing on a second-by-second basis as clouds passed by.

That caused the voltage on the circuit to which it's connected to fluctuate beyond the standards, as more power had to be brought in to deal with it.

Voltage is a function of how much power is on a system and where it comes from fluctuations can cause malfunctions for customers.

And things will get even more interesting if, as SDG&E predicts, people turn to plug-in cars in larger numbers. Many of those who will drive electric also own rooftop solar panels.

So, what can be done about it?

There's no silver bullet, but researchers are working on a variety of solutions that include better forecasting, energy storage and more information about how the grid works.

Tracking clouds as they move across a city will give the utility a better idea of where and when solar generation will happen. Forecasting customer behavior — like when people plug in their cars — will help.

But information gathered from smart meters and sensors and weather stations around a region will also give a better picture of what's happening on the grid.

And when power production suddenly drops, something has to make up for it. That can include power plants that have turbines already spinning and ready to put juice on the grid, but also storage in capacitors or batteries near customers.

These changes will also affect how much it costs to run the grid and who has to pay for it.

Most solar customers right now put extra power they make during the day on the grid, then draw power at night when the sun is not shining.

In effect, they're using the grid as a giant battery.

Right now, the cost of the wires, cables and substations is included as part of the electricity, the actual energy you use. But if people are making as much electricity as they use — or if they make more — they're not paying for the cost of running the grid.

Related News

Global CO2 emissions 'flatlined' in 2019, says IEA

2019 Global CO2 Emissions stayed flat, IEA reports, as renewable energy growth, wind and solar deployment, nuclear output, and coal-to-gas switching in advanced economies offset increases elsewhere, supporting climate goals and clean energy transitions.


Key Points

33 gigatonnes, unchanged YoY, as advanced economies cut power emissions via renewables, gas, and nuclear.

✅ IEA reports emissions flat at 33 Gt despite 2.9% GDP growth

✅ Advanced economies cut power-sector CO2 via wind, solar, gas

✅ Nuclear restarts and mild weather aided reductions


Despite widespread expectations of another increase, global energy-related CO2 emissions stopped growing in 2019, according to International Energy Agency (IEA) data released today. After two years of growth, global emissions were unchanged at 33 gigatonnes in 2019, a notable marker in the global energy transition narrative even as the world economy expanded by 2.9%.

This was primarily due to declining emissions from electricity generation in advanced economies, thanks to the expanding role of renewable sources (mainly wind and solar across many markets), fuel switching from coal to natural gas, and higher nuclear power generation, the Paris-based organisation says in the report.

"We now need to work hard to make sure that 2019 is remembered as a definitive peak in global emissions, not just another pause in growth," said Fatih Birol, the IEA's executive director. "We have the energy technologies to do this, and we have to make use of them all."

Higher nuclear power generation in advanced economies, particularly in Japan and South Korea, avoided over 50 Mt of CO2 emissions. Other factors included milder weather in several countries, and slower economic growth in some emerging markets. In China, emissions rose but were tempered by slower economic growth and higher output from low-carbon sources of electricity. Renewables continued to expand in China, and 2019 was also the first full year of operation for seven large-scale nuclear reactors in the country.

A significant decrease in emissions in advanced economies in 2019 offset continued growth elsewhere. The USA recorded the largest emissions decline on a country basis, with a fall of 140 million tonnes, or 2.9%. US emissions are now down by almost 1 gigatonne from their peak in 2000. Emissions in the European Union fell by 160 million tonnes, or 5%, in 2019 driven by reductions in the power sector as electricity producers move away from coal in the generation mix. Japan’s emissions fell by 45 million tonnes, or around 4%, the fastest pace of decline since 2009, as output from recently restarted nuclear reactors increased.

Emissions in the rest of the world grew by close to 400 million tonnes in 2019, with almost 80% of the increase coming from countries in Asia where coal-fired power generation continued to rise, and in Australia emissions rose 2% due to electricity and transport. Coal-fired power generation in advanced economies declined by nearly 15%, reflecting a sharp fall in coal-fired electricity across multiple markets, as a result of growth in renewables, coal-to-gas switching, a rise in nuclear power and weaker electricity demand.

The IEA will publish a World Energy Outlook Special Report in June that will map out how to cut global energy-related carbon emissions by one-third by 2030 and put the world on track for longer-term climate goals, a pathway that, in Canada, will require more electricity to hit net-zero. It will also hold an IEA Clean Energy Transitions Summit in Paris on 9 July, bringing together key government ministers, CEOs, investors and other major stakeholders.

Birol will discuss the results published today tomorrow at an IEA Speaker Series event at its headquarters with energy and climate ministers from Poland, which hosted COP24 in Katowice; Spain, which hosted COP25 in Madrid; and the UK, which will host COP26 in Glasgow this year, as greenhouse gas concentrations continue to break records worldwide.


Related News

View more

94,000 lose electricity in LA area after fire at station

Los Angeles Power Station Fire prompts LADWP to shut a Northridge/Reseda substation, causing a San Fernando Valley outage amid a heatwave; high-voltage equipment and mineral oil burned as 94,000 customers lost power, elevator rescues reported.


Key Points

An LADWP substation fire in Northridge/Reseda caused a major outage; 94,000 customers affected as crews restore power.

✅ Fire started around 6:52 p.m.; fully extinguished by 9 p.m.

✅ High-voltage gear and mineral oil burned; no injuries reported.

✅ Outages hit Porter Ranch, Reseda, West Hills, Granada Hills.


About 94,000 customers were without electricity Saturday night after the Los Angeles Department of Water and Power shut down a power station in the northeast San Fernando Valley that caught fire, the agency said.

The fire at the station in the Northridge/Reseda area of Los Angeles started about 6:52 p.m. and involved equipment that carries high-voltage electricity and distributes it at lower voltages to customers in the surrounding area, the department said, even as other utilities sometimes deploy wildfire safety shut-offs to reduce risk during dangerous conditions.

The department shut off power to the station as a precautionary move, and it is restoring power now that the fire has been put out, similar to restoration after intentional shut-offs in other parts of California. Initially, 140,000 customers were without power. That number had been cut to 94,000 by 11 p.m.

The power outage comes as much of California baked in heat that broke records, and rolling blackout warnings were issued as the grid strained. A record that stood 131 years in Los Angeles was snapped when the temperature spiked at 98 degrees downtown.

People reported losing power in Porter Ranch, Winnetka, West Hills, Canoga Park, Woodland Hills, Granada Hills, North Hills, Reseda and Chatsworth, KABC TV reported, highlighting electricity inequality across communities.

Shortly after the blaze broke out, firefighters found a huge container of mineral oil that is used to cool electrical equipment on fire, Los Angeles Fire Department spokesman Brian Humphrey told the Los Angeles Times. The incident underscores infrastructure risks that in some regions have required a complete grid rebuild after severe storms.

Firefighters had the blaze under control by 8:30 p.m. and were able to put it out by 9 p.m., Humphrey said. "These were fierce flames, with smoke towering more than 300 feet into the sky," he told the newspaper.

No one was injured.

Firefighters rescued people who were stranded in elevators, Humphrey said.


Related News

View more

Two huge wind farms boost investment in America’s heartland

MidAmerican Energy Wind XI expands Iowa wind power with the Beaver Creek and Prairie farms, 169 turbines and 338 MW, delivering renewable energy, grid reliability, rural jobs, and long-term tax revenue through major investment.


Key Points

MidAmerican Energy Wind XI is a $3.6B Iowa wind buildout adding 2,000 MW to enhance reliability, jobs, and tax revenue.

✅ 169 turbines at Beaver Creek and Prairie deliver 338 MW.

✅ Wind supplies 36.6 percent of Iowa electricity generation.

✅ Projects forecast $62.4M in property taxes over 20 years.


Power company MidAmerican Energy recently announced the beginning of operations at two huge wind farms in the US state of Iowa.

The two projects, called Beaver Creek and Prairie, total 169 turbines and have a combined capacity of 338 megawatts (MW), enough to meet the annual electricity needs of 140,000 homes in the state.

“We’re committed to providing reliable service and outstanding value to our customers, and wind energy accomplishes both,” said Mike Fehr, vice president of resource development at MidAmerican. “Wind energy is good for our customers, and it’s an abundant, renewable resource that also energizes the economy.”

The wind farms form part of MidAmerican Energy’s major Wind XI project, which will see an extra 2,000MW of wind power built, and $3.6 billion invested amid notable wind farm acquisitions shaping the market by the end of 2019. The company estimates it is the largest economic development project in Iowa’s history.

Iowa is something of a hidden powerhouse in American wind energy. The technology provides an astonishing 36.6 percent of the state’s entire electricity generation and plays a growing role in the U.S. electricity mix according to the American Wind Energy Association (AWEA). It also has the second largest amount of installed capacity in the nation at 6917MW; Texas is first with over 21,000MW.

Along with capital investment, wind power brings significant job opportunities and tax revenues for the state. An estimated 9,000 jobs are supported by the industry, something a U.S. wind jobs forecast stated could grow to over 15,000 within a couple of years.

MidAmerican Energy is also keen to stress the economic benefits of its new giant projects, claiming that they will bring in $62.4 million of property tax revenue over their 20-year lifetime.

Tom Kiernan, AWEA’s CEO, revealed last year that, as the most-used source of renewable electricity in the U.S., wind energy is providing more than five states in the American Midwest with over 20 percent of electricity generation, “a testament to American leadership and innovation”.

“For these states, and across America, wind is welcome because it means jobs, investment, and a better tomorrow for rural communities”, he added.


Related News

View more

Calgary's electricity use soars in frigid February, Enmax says

Calgary Winter Energy Usage Surge highlights soaring electricity demand, added megawatt-hours, and grid reliability challenges driven by extreme cold, heating loads, and climate change, with summer air conditioning also shifting seasonal peaks.


Key Points

A spike in Calgary's power use from extreme cold, adding 22k MWh and testing reliability as heating demand rises.

✅ +22,000 MWh vs Feb 2018 amid fourth-coldest February

✅ Heating loads spike; summer A/C now drives peak demand

✅ Grid reliability monitored; more solar and green resources ahead


February was so cold in Calgary that the city used enough extra energy to power 3,400 homes for a whole year, echoing record-breaking demand in B.C. in 2021 during severe cold.

Enmax Power Corporation, the primary electricity utility in the city, says the city 's energy consumption was up 22,000 megawatt hours last month compared with Februray 2018.

"We've seen through this cold period our system has held up very well. It's been very reliable," Enmax vice-president Andre van Dijk told the Calgary Eyeopener on Friday. "You know, in the absence of a windstorm combined with cold temperatures and that sort of thing, the system has actually held up pretty well."

The past month was the fourth coldest in Calgary's history, and similar conditions have pushed all-time high demand in B.C. in recent years across the West. The average temperature for last month was –18.1 C. The long-term average for February is –5.4 C.


Watching use, predicting issues

The electricity company monitors demand and load on a daily basis, always trying to predict issues before they happen, van Dijk said, and utilities have introduced winter payment plans to help customers manage bills during prolonged cold.

One of the issues they're watching is climate change, and how extreme temperatures and weather affect both the grid's reliability, as seen when Quebec shattered consumption records during cold snaps, and the public's energy use.

The colder it gets, the higher you turn up the heat. The hotter it is, the more you use air conditioning.

He also noted that using fuels then contributes to climate change, creating a cycle.

​"We are seeing variations in temperature and we've seen large weather events across the continent, across the world, in fact, that impact electrical systems, whether that's flooding, as we've experienced here, or high winds, tornadoes," van Dijk said.

"Climate change and changing weather patterns have definitely had had an impact on us as an electrical industry."

In 2012, he said, Calgary switched from using the most power during winter to using the most during summer, in large part due to air conditioning, he said.

"Temperature is a strong influencer of energy consumption and of our demand," van Dijk said.

Christmas tree lights have also become primarily LED, van Dijk said, which cuts down on a big energy draw in the winter.

He said he expects more solar and other green resources will be added into the electrical system in the future to mitigate how much the increasingly levels of energy use impact climate change, and to help moderate electricity costs in Alberta over time.


Related News

View more

During this Pandemic, Save Money - How To Better Understand Your Electricity Bill

Commercial Electric Tariffs explain utility rate structures, peak demand charges, kWh vs kW pricing, time-of-use periods, voltage, delivery, capacity ratchets, and riders, guiding facility managers in tariff analysis for accurate energy savings.


Key Points

Commercial electric tariffs define utility pricing for energy, demand, delivery, time-of-use periods, riders, and ratchet charges.

✅ Separate kWh charges from kW peak demand fees.

✅ Verify time-of-use windows and demand interval length.

✅ Review riders, capacity ratchets, and minimum demand clauses.


Especially during these tough economic times, as major changes to electric bills are debated in some states, facility executives who don’t understand how their power is priced have been disappointed when their energy projects failed to produce expected dollar savings. Here’s how not to be one of them.

Your electric rate is spelled out in a document called a “tariff” that can be downloaded from your utility’s web page. A tariff should clearly spell out the costs for each component that is part of your rate, reflecting cost allocation practices in your region. Don’t be surprised to learn that it contains a bunch of them. Unlike residential electric rates, commercial electric bills are not based solely on the quantity of kilowatt-hours (kWh) consumed in a billing period (in the United States, that’s a month). Instead, different rates may apply to how your power is supplied, how it is delivered via electricity delivery charges, when it was consumed, its voltage, how fast it was used (in kW), and other factors.

If a tariff’s lingo and word structure are too opaque, spend some time with a utility account rep to translate it. Many state utility commissions also have customer advocates that may assist as they explore new utility rate designs that affect customers. Alternatively, for a fee, facility managers can privately chat with an energy consultant.

Common mistakes

Many facility managers try to estimate savings based on an averaged electric rate, i.e., annual electric spend divided by annual kWh. However, in markets where electricity demand is flat, such a number may obscure the fastest rising cost component: monthly peak demand charges, measured in dollars per kW (or kilo-volt-amperes, kVA).

This charge is like a monthly speeding ticket, based solely on the highest speed you drove during that time. In some areas, peak demand charges now account for 30 to 60 percent of a facility’s annual electric spend. When projecting energy cost savings, failing to separately account for kW peak demand and kWh consumption may result in erroneous results, and a lot of questions from the C-suite.

How peak demand charges are calculated varies among utilities. Some base it on the highest average speed of use across one hour in a month, while others may use the highest average speed during a 15- or 30-minute period. Others may average several of the highest speeds within a defined time period (for example, 8 a.m. to 6 p.m. on weekdays). It is whatever your tariff says it is.

Because some power-consuming (or producing) devices, including those tied to smart home electricity networks, vary in their operation or abilities, they may save money on a few — but not all — of those rate components. If an equipment vendor calculates savings from its product by using an average electric rate, take pause. Tell the vendor to return after the proposal has been redone using tariff-based numbers.

When a vendor is the only person calculating potential savings from using a product, there’s also a built-in conflict of interest: The person profiting from an equipment sale should not also be the one calculating its expected financial return. Before signing any energy project contracts, it’s essential that someone independent of the deal reviews projected savings. That person (typically an energy or engineering consultant) should be quite familiar with your facility’s electric tariff, including any special provisions, riders, discounts, etc., that may pertain. When this doesn’t happen, savings often don’t occur as planned. 

For example, some utilities add another form of demand charge, based on the highest kW in a year. It has various names: capacity, contract demand, or the generic term “ratchet charge.” Some utilities also have a minimum ratchet charge which may be based on a percent of a facility’s annual kW peak. It ensures collection of sufficient utility revenue to cover the cost of installed transmission and distribution even when a customer significantly cuts its peak demand.


Related News

View more

BloombergNEF: World offshore wind costs 'drop 32% per cent'

Global Renewable LCOE Trends reveal offshore wind costs down 32%, with 10MW turbines, lower CAPEX and OPEX, and parity for solar PV and onshore wind in Europe, China, and California, per BloombergNEF analysis.


Key Points

Benchmarks showing falling LCOE for offshore wind, onshore wind, and solar PV, driven by larger turbines and lower CAPEX

✅ Offshore wind LCOE $78/MWh; $53-64/MWh in DK/NL excl. transmission

✅ Onshore wind $47/MWh; solar PV $51/MWh, best $26-36/MWh

✅ Cost drivers: 10MW turbines, lower CAPEX/OPEX, weak China demand


World offshore wind costs have fallen 32% from just a year ago and 12% compared with the first half of 2019, according to a BNEF long-term outlook from BloombergNEF.

In its latest Levelized Cost of Electricity (LCOE) Update, BloombergNEF said its current global benchmark LCOE estimate for offshore wind is $78 a megawatt-hour.

“New offshore wind projects throughout Europe, including the UK's build-out, now deploy turbines with power ratings up to 10MW, unlocking CAPEX and OPEX savings,” BloombergNEF said.

In Denmark and the Netherlands, it expects the most recent projects financed to achieve $53-64/MWh excluding transmission.

New solar and onshore wind projects have reached parity with average wholesale power prices in California and parts of Europe, while in China levelised costs are below the benchmark average regulated coal price, according to BloombergNEF.

The company's global benchmark levelized cost figures for onshore wind and PV projects financed in the last six months are at $47 and $51 a megawatt-hours, underscoring that renewables are now the cheapest new electricity option in many regions, down 6% and 11% respectively compared with the first half of 2019.

BloombergNEF said for wind this is mainly down to a fall in the price of turbines – 7% lower on average globally compared with the end of 2018.

In China, the world’s largest solar market, the CAPEX of utility-scale PV plants has dropped 11% in the last six months, reaching $0.57m per MW.

“Weak demand for new plants in China has left developers and engineering, procurement and construction firms eager for business, and this has put pressure on CAPEX,” BloombergNEF said.

It added that estimates of the cheapest PV projects financed recently – in India, Chile and Australia – will be able to achieve an LCOE of $27-36/MWh, assuming competitive returns for their equity investors.

Best-in-class onshore wind farms in Brazil, India, Mexico and Texas can reach levelized costs as low as $26-31/MWh already, the research said.

Programs such as the World Bank wind program are helping developing countries accelerate wind deployment as costs continue to drop.

BloombergNEF associate in the energy economics team Tifenn Brandily said: “This is a three- stage process. In phase one, new solar and wind get cheaper than new gas and coal plants on a cost-of- energy basis.

“In phase two, renewables reach parity with power prices. In phase three, they become even cheaper than running existing thermal plants.

“Our analysis shows that phase one has now been reached for two-thirds of the global population.

“Phase two started with California, China and parts of Europe. We expect phase three to be reached on a global scale by 2030.

“As this all plays out, thermal power plants will increasingly be relegated to a balancing role, looking for opportunities to generate when the sun doesn’t shine or the wind doesn’t blow.”


Related News

View more

Sign Up for Electricity Forum’s Newsletter

Stay informed with our FREE Newsletter — get the latest news, breakthrough technologies, and expert insights, delivered straight to your inbox.

Electricity Today T&D Magazine Subscribe for FREE

Stay informed with the latest T&D policies and technologies.
  • Timely insights from industry experts
  • Practical solutions T&D engineers
  • Free access to every issue

Live Online & In-person Group Training

Advantages To Instructor-Led Training – Instructor-Led Course, Customized Training, Multiple Locations, Economical, CEU Credits, Course Discounts.

Request For Quotation

Whether you would prefer Live Online or In-Person instruction, our electrical training courses can be tailored to meet your company's specific requirements and delivered to your employees in one location or at various locations.