Italy plans to resume building atomic plants

By New York Times


CSA Z463 Electrical Maintenance

Our customized live online or in‑person group training can be delivered to your staff at your location.

  • Live Online
  • 6 hours Instructor-led
  • Group Training Available
Regular Price:
$249
Coupon Price:
$199
Reserve Your Seat Today
Italy announced that within five years it planned to resume building nuclear energy plants, two decades after a public referendum resoundingly banned nuclear power and deactivated all its reactors.

“By the end of this legislature, we will put down the foundation stone for the construction in our country of a group of new-generation nuclear plants,” said Claudio Scajola, minister of economic development. “An action plan to go back to nuclear power cannot be delayed anymore.”

The change is a striking sign of the times, reflecting growing concern in many European countries over the skyrocketing price of oil and energy security, and the warming effects of carbon emissions from fossil fuels. All have combined to make this once-scorned form of energy far more palatable.

“Italy has had the most dramatic, the most public turnaround, but the sentiments against nuclear are reversing very quickly all across Europe — Holland, Belgium, Sweden, Germany and more,” said Ian Hore-Lacey, spokesman for the World Nuclear Association, an industry group based in London.

The rehabilitation of nuclear power was underscored in January when John Hutton, the British business secretary, grouped it with “other low-carbon sources of energy” like biofuels. It was barely mentioned in the government action plan on energy three years earlier.

Echoing the sentiment, Mr. Scajola said, “Only nuclear plants safely produce energy on a vast scale with competitive costs, respecting the environment.”

A number of European countries have banned or restricted nuclear power in the past 20 years, including Italy, which closed all its plants. Germany and Belgium have long prohibited the building of reactors, although existing ones were allowed to run their natural lifespan. France was one of the few countries that continued to rely heavily on nuclear power.

Environmental groups in Italy immediately attacked any plan to bring back nuclear power. Giuseppe Onufrio, a director of Greenpeace Italy, called the announcement “a declaration of war.”

Emma Bonino, an opposition politician and vice president of the Italian Senate, said building nuclear plants made no economic sense because they would not be ready for at least 20 years.

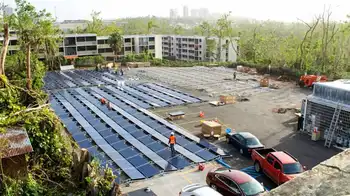
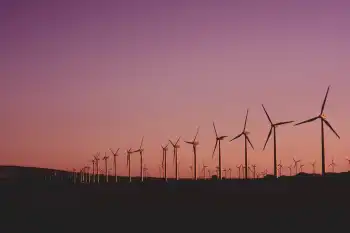
“We should be investing more in solar and wind,” she said. “We should be moving much more quickly to improve energy efficiency, of buildings, for example. That’s something Italy has never done anything with.”

But conditions were very different in the 1980s, when European countries turned away from nuclear power. Oil cost less than $50 a barrel, global warming was a fringe science and climate change had not been linked to manmade emissions. Perhaps more important for the public psyche, almost all of EuropeÂ’s nuclear bans and restrictions were enacted after the 1986 Chernobyl disaster in the Soviet Union in which radioactivity was released into the environment.

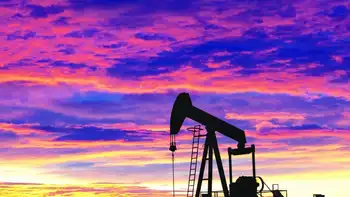
The equation has changed. Today, with oil approaching $150 a barrel, most European countries, which generally have no oil and gas resources, have been forced by finances to consider new forms of energy — and fast. New nuclear plants take 20 years to build. Also, Europeans watched in horror in 2006 as President Vladimir V. Putin of Russia cut off the natural gas supply to Ukraine in a price dispute, leaving it in darkness.

New green technologies, like solar power, wind and biofuel, cannot yet form the backbone of a countryÂ’s energy strategy, and it is not clear that they will ever achieve that level.

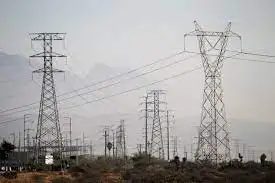
Italy is the largest net energy importer in Europe, but nearly all European countries rely heavily on imported energy — particularly oil and gas.

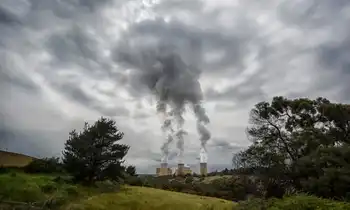
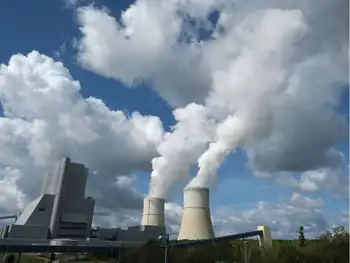
Enel, Italy’s leading energy provider, announced this year that it would close its oil-fired power plants because the fuel had become unaffordable. Italians pay the highest energy prices in Europe. Enel has been building coal plants to fill the void left by oil. Coal plants are cheaper but create relatively high levels of carbon emissions, even using the type of new “clean coal” technology Enel had planned.

A few European countries, like Germany and Poland, could likewise fall back on their abundant coal reserves if they rejected oil and gas — but most of the coal mined in each country is of low grade and pollutes highly.

After the government announcement opening Italy to nuclear power, Enel’s managing director, Fulvio Conti, said, “We are ready.” But he added that “new regulation and strong agreement on the plan within the country” would be needed.

Enel, which operates power plants in several European countries, already has at least one nuclear plant, in Bulgaria, and has been researching so-called fourth-generation nuclear reactors, which are intended to be safer and to minimize waste and the use of natural resources. ItalyÂ’s old reactors still exist, but are too outdated to be reopened. New ones would have to be built.

The Italian government laid out few specifics to back its announcement and officials at the Ministry of Economic Development said they were still studying issues like exactly what kind of plants could be built, and whether a new referendum would be required to re-open Italy to nuclear power.

Marzia Marzioli, who leads a citizens’ campaign against new coal plants in Italy, said nuclear was equally repellent. “As with coal, nuclear energy is the exact opposite of what we would like for Italy.”

“It is a choice that doesn’t consider the alternatives,” such as solar power, she said.

To build nuclear plants, Italy would almost certainly have to improve its system of dealing with nuclear waste. The plants that were shut down years ago still store 235 tons of nuclear fuel.

Related News

OPINION Rewiring Indian electricity

India Power Sector Crisis: a tangled market of underused plants, coal shortages, cross-subsidies, high transmission losses, and weak PPAs, requiring deregulation, power exchanges, and cost-reflective tariffs to fix insolvency and outages.


Key Points

India power market failure from subsidies, coal shortages, and losses, needing deregulation and reflective pricing.

✅ Deregulate to enable spot trading on power exchanges

✅ End cross-subsidies; charge cost-reflective tariffs

✅ Secure coal supply; cut T&D losses and theft


India's electricity industry is in a financial and political tangle.

Power producers sit on thousands of megawatts of underutilized plant, while consumers face frequent power cuts, both planned and unplanned.

Financially troubled generators struggle to escape insolvency proceedings. The state-owned banks that have mostly financed power utilities fear that debts of troubled utilities totaling 1.74 trillion rupees will soon go bad.

Aggressive bidding for supply contracts and slower-than-expected demand growth, including a recent demand slump in electricity use, is the root cause. The problems are compounded by difficulties in securing coal and other fuels, high transmission losses, electricity theft and cash-starved distribution companies.

But India's 36 state and union territory governments are contributing mightily to this financial and economic mess. They persist with populist cross-subsidies -- reducing charges for farmers and households at the cost of nonagricultural businesses, especially energy-intensive manufacturing sectors such as steel.

The states refuse to let go of their control over how electricity is produced, distributed and consumed. And they are adamant that true markets, with freedom for large industrial users to buy power at market-determined rates from whichever utility they want at power exchanges -- will not become a reality in India.

State politicians are driven mainly by the electoral need to appease farmers, India's most important vote bank, who have grown used to decades of nearly-free power.

New Delhi is therefore relying on short-term fixes instead of attempting to overhaul a defunct system. Users must pay the real cost of their electricity, as determined by a properly integrated national market free of state-level interference if India's power mess is to be really addressed.

As of Aug. 31, the country's total installed production capacity was 344,689 MW, underscoring its status as the third-largest electricity producer globally by output. Out of that, thermal power comprising coal, gas and diesel accounted for 64%, hydropower 13% and renewables accounted for 20%. Commercial and industrial users accounted for 55% of consumption followed by households on 25% and the remaining 20% by agriculture.

Coal-fired power generation, which contributes roughly 90% of thermal output and the bulk of the financially distressed generators, is the most troubled segment as it faces a secular decline in tariffs due to increasing competition from highly subsidized renewables (which also benefit from falling solar panel costs), coal shortages and weak demand.

The Central Electricity Act (CEA) 2003 opened the gates of the country's power sector for private players, who now account for 45% of generating capacity.

But easy credit, combined with an overconfident estimation of the risks involved, emboldened too many investors to pile in, without securing power purchase agreements (PPAs) with distribution companies.

As a result, power capacity grew at an annual compound rate of 11% compared to demand at 6% in the last decade leading to oversupply.

This does not mean that the electricity market is saturated. Merely that there are not enough paying customers. Distributors have plenty of consumers who will not or cannot pay, even though they have connections. There is huge unmet demand for power. There are 32 million Indian homes -- roughly 13% of the total -- mostly rural and poor with no access to electricity.

Moreover, consumption by those big commercial and industrial users which do not enjoy privileged rates is curbed by high prices, driven up by the cost of subsidizing others, extra charges on exchange-traded power and transmission and distribution losses (including theft) of 20-30%.

With renewables increasingly becoming cheaper, financially stressed distributors are avoiding long-term power purchase agreements, preferring spot markets. Meanwhile, coal shortages force generators to buy expensive imported coal supplies or cut output. The operating load for most private generators, which suffer particularly acute coal shortages in compared to state-owned utilities, has fallen from 84% in 2009-2010 to 55% now.

Smoothing coal supplies should be the top priority. Often coal is denied to power generators without long-term purchase contracts. Such discrimination in coal allocation prevails -- because the seller (state-run Coal India and its numerous subsidiaries) is an inefficient monopolist which cannot produce enough and rations coal supplies, favoring state-run generators over private.

To help power producers, New Delhi plans measures including auctioning power sales contracts with assured access to coal. However, even though coal and electricity shortages eased recently, such short-term fixes won't solve the problem. With electricity prices in secular decline, distributors are not seeking long-term supply contracts -- rather they are often looking for excuses to get out of existing agreements.

India needs a fundamental two-step reform. First, the market must be deregulated to allow most bulk suppliers and users to move to power trading exchanges, which currently account for just 10% of the market.

This would lead to genuine price discovery in a spot market and, in time, lead to the trading of electricity futures contracts. That would help in consumers and producers hedge their respective costs and revenues and safeguard their economic positions without any need for government intervention.

The second step to a healthy electricity industry is for consumers to pay the real cost of power. Cross-subsidization must end. That would promote optimal electricity use, innovation and environmental protection. Farmers enjoying nearly-free power create ecological problems by investing in water-guzzling crops such as rice and sugar cane.

Most industrial consumers, who do not have power supply privileges, have their businesses distorted and delayed by high prices. Lowering their costs would encourage power-intensive manufacturing to expand, and in the process, boost electricity demand and improve capacity utilization.

Of course, cutting theft is central to making consumers pay their way. Government officials must stop turning a blind eye to theft, especially when such transmission and distribution losses average 20%.

Politicians who want to continue subsidizing farmers or assist the poor can do so by paying cash out directly to their bank accounts, instead of wrongly relying on the power sector.

Such market-oriented reforms have long been blocked by state-level politicians, who now enjoy the influence born of operating subsidies and interfering in the sector. New Delhi must address this opposition. Narendra Modi, as a self-styled reforming prime minister, should have the courage to bite this bullet and convince state governments (starting with those ruled by his Bharatiya Janata Party) to reform. To encourage cooperation, he could offer states securing real improvements an increased share of centrally collected taxes.

Ritesh Kumar Singh is to be the chief economist of the new policy research and advocacy company Indonomics Consulting. He is former assistant director of the Finance Commission of India.


Related News

View more

Idaho gets vast majority of electricity from renewables, almost half from hydropower

Idaho Renewable Energy 2018 saw over 80% in-state utility-scale power from hydropower, wind, solar, biomass, and geothermal, per EIA, with imports declining as Snake River Plain resources and Hells Canyon hydro lead.


Key Points

Idaho produced over 80% in-state power from renewables in 2018, led by hydropower, wind, solar, and biomass.

✅ Hydropower supplies about half of capacity; Hells Canyon leads.

✅ Wind provides nearly 20% of capacity along the Snake River Plain.

✅ Utility-scale solar surged since 2016; biomass and geothermal add output.


More than 80% of Idaho’s in-state utility-scale electricity generation came from renewable resources in 2018, behind only Vermont, according to recently released data from the U.S. Energy Information Administration’s Electric Power Monthly and broader trends showing that solar and wind reached about 10% of U.S. generation in the first half of 2018.

Idaho generated 17.4 million MWh of electricity in 2018, of which 14.2 million MWh came from renewable sources, while nationally January power generation jumped 9.3% year over year according to EIA. Idaho uses a variety of renewable resources to generate electricity:

Hydroelectricity. Idaho ranked seventh in the U.S. in electricity generation from hydropower in 2018. About half of Idaho’s electricity generating capacity is at hydroelectric power plants, and utility actions such as the Idaho Power settlement could influence future resource choices, and seven of the state’s 10 largest power plants (in terms of electricity generation) are hydroelectric facilities. The largest privately owned hydroelectric generating facility in the U.S. is a three-dam complex on the Snake River in Hells Canyon, the deepest river gorge in North America.

Wind. Nearly one-fifth of Idaho’s electricity generating capacity and one-sixth of its generation comes from wind turbines. Idaho has substantial wind energy potential, and nationally the EIA expects solar and wind to be larger sources this summer, although only a small percentage of the state's land area is well-suited for wind development. All of the state’s wind farms are located in the southern half of the state along the Snake River Plain.

Solar. Almost 5% of Idaho’s electricity generating capacity and 3% of its generation come from utility-scale solar facilities, and nationally over half of new capacity in 2023 will be solar according to projections. The state had no utility-scale solar generation as recently as 2015. Between 2016 and 2017, Idaho’s utility-scale capacity doubled and generation increased from 30,000 MWh to more than 450,000 MWh. Idaho’s small-scale solar capacity also doubled since 2017, generating 33,000 MWh in 2018.

Biomass. Biomass-fueled power plants account for about 2% of the state’s utility-scale electricity generating capacity and 3% of its generation, contributing to a broader U.S. shift where 40% of electricity came from non-fossil sources in 2021. Wood waste from the state’s forests is the primary fuel for these plants.

Geothermal. Idaho is one of seven states with utility-scale geothermal electricity generation. Idaho has one 18-MW geothermal facility, located near the state’s southern border with Utah.

EIA says Idaho requires significant electricity imports, totaling about one-third of demand, to meet its electricity needs. However, Idaho’s electricity imports have decreased over time, and Georgia's recent import levels illustrate how regional dynamics can vary. Almost all of these imports are from neighboring states, as electricity imports from Canada accounted for less than 0.1% of Idaho’s total electricity supply in 2017.


Related News

View more

Power Demand Seen Holding Firm In Europe’s Latest Lockdown

European Power Demand During Second Lockdowns remains resilient as winter heating offsets commercial losses; electricity consumption tracks seasonal norms, with weather sensitivity, industrial activity, natural gas shielding, and coal decline shaping dynamics under COVID-19 restrictions.


Key Points

It is expected to remain near seasonal norms, driven by heating, industry activity, and weather sensitive consumption.

✅ Winter heating offsets retail and hospitality closures

✅ Demand sensitivity rises with colder weather in France

✅ Gas generation shielded; coal likely to curtail first


European power demand is likely to hold up in the second round of national lockdown restrictions, with fluctuations most likely driven by changes in the weather.

Traders and analysts expect normal consumption this time around as home heating during the chilly season replaces commercial demand.

Last week electricity consumption in France, Germany and the U.K. was close to business-as-usual levels for the time of year, according to BloombergNEF data. By contrast, power demand had dropped 16% in the first seven days of the springtime lockdown, as reflected by the U.K.’s 10% daily decline reported then.

How power demand performs has significance outside the sector. It’s often seen as a proxy for economic growth and during lockdowns earlier this year, electricity use slumped along with GDP, and stunted hydro and nuclear output could further hobble recovery. For Western Europe, annual demand is expected to be 5% lower than the previous year, a bigger decline than after the global financial crisis in 2008, according to S&P Global Platts.

The Covid-19 limits are lighter than those from earlier in the year “with an explicit drive to preserve economic activity, particularly at the more energy-intensive industrial end of the spectrum,” said Glenn Rickson, head of European power analysis at S&P Global Platts.

Higher levels of working from home will offset some of the losses from shop and hospitality closures, “but also increase the temperature sensitivity of overall gas and power demand, as heat-driven demand records have shown in recent summers,” he said.

The latest wave of national lockdowns began in France, Germany, Spain, Italy and Britain, with Spain having seen April demand plummet earlier in the year, as coronavirus cases surged and officials struggled to keep the spread of the virus under control.

Much of the manufacturing industry remains working for now despite additional restrictions to contain the coronavirus. With the peak of the second wave yet to be reached, “it seems almost inevitable that the fourth quarter will prove economically challenging,” analysts at Alfa Energy said.

There will initially be significantly less of an impact on demand compared with this spring when global daily demand dipped about 15% and electricity consumption in Europe was down 30%, Johan Sigvardsson, power price analyst at Swedish utility Bixia AB said.

The prevalence of electric heating systems in France means that power demand is particularly sensitive to cold weather. A cold spell would significantly boost demand and drive record electricity prices in tight markets.

Similar to the last round of shutdowns, it’s use of coal that will probably be hit first if power demand sags, as transition-focused responses gather pace, leaving natural gas mostly shielded from fluctuations in the market.

“We expect that another drop in power demand would again impact coal-fired generation and shield gas power to some extent,” said Carlos Torres Diaz, an analyst at Rystad Energy.


Related News

View more

Which of the cleaner states imports dirty electricity?

Hourly Electricity Emissions Tracking maps grid balancing areas, embodied emissions, and imports/exports, revealing carbon intensity shifts across PJM, ERCOT, and California ISO, and clarifying renewable energy versus coal impacts on health and climate.


Key Points

An hourly method tracing generation, flows, and embodied emissions to quantify carbon intensity across US balancing areas.

✅ Hourly traces of imports/exports and generation mix

✅ Consumption-based carbon intensity by balancing area

✅ Policy insights for renewables, coal, health costs


In the United States, electricity generation accounts for nearly 30% of our carbon emissions. Some states have responded to that by setting aggressive renewable energy standards; others are hoping to see coal propped up even as its economics get worse. Complicating matters further is the fact that many regional grids are integrated, and as America goes electric the stakes grow, meaning power generated in one location may be exported and used in a different state entirely.

Tracking these electricity exports is critical for understanding how to lower our national carbon emissions. In addition, power from a dirty source like coal has health and environment impacts where it's produced, and the costs of these aren't always paid by the parties using the electricity. Unfortunately, getting reliable figures on how electricity is produced and where it's used is challenging, even for consumers trying to find where their electricity comes from in the first place, leaving some of the best estimates with a time resolution of only a month.

Now, three Stanford researchers—Jacques A. de Chalendar, John Taggart, and Sally M. Benson—have greatly improved on that standard, and they have managed to track power generation and use on an hourly basis. The researchers found that, of the 66 grid balancing areas within the United States, only three have carbon emissions equivalent to our national average, and they have found that imports and exports of electricity have both seasonal and daily changes. de Chalendar et al. discovered that the net results can be substantial, with imported electricity increasing California's emissions/power by 20%.

Hour by hour
To figure out the US energy trading landscape, the researchers obtained 2016 data for grid features called balancing areas. The continental US has 66 of these, providing much better spatial resolution on the data than the larger grid subdivisions. This doesn't cover everything—several balancing areas in Canada and Mexico are tied in to the US grid—and some of these balancing areas are much larger than others. The PJM grid, serving Pennsylvania, New Jersey, and Maryland, for example, is more than twice as large as Texas' ERCOT, in a state that produces and consumes the most electricity in the US.

Despite these limitations, it's possible to get hourly figures on how much electricity was generated, what was used to produce it, and whether it was used locally or exported to another balancing area. Information on the generating sources allowed the researchers to attach an emissions figure to each unit of electricity produced. Coal, for example, produces double the emissions of natural gas, which in turn produces more than an order of magnitude more carbon dioxide than the manufacturing of solar, wind, or hydro facilities. These figures were turned into what the authors call "embodied emissions" that can be traced to where they're eventually used.

Similar figures were also generated for sulfur dioxide and nitrogen oxides. Released by the burning of fossil fuels, these can both influence the global climate and produce local health problems.

Huge variation
The results were striking. "The consumption-based carbon intensity of electricity varies by almost an order of magnitude across the different regions in the US electricity system," the authors conclude. The low is the Bonneville Power grid region, which is largely supplied by hydropower; it has typical emissions below 100kg of carbon dioxide per megawatt-hour. The highest emissions come in the Ohio Valley Electric region, where emissions clear 900kg/MW-hr. Only three regional grids match the overall grid emissions intensity, although that includes the very large PJM (where capacity auction payouts recently fell), ERCOT, and Southern Co balancing areas.

Most of the low-emissions power that's exported comes from the Pacific Northwest's abundant hydropower, while the Rocky Mountains area exports electricity with the highest associated emissions. That leads to some striking asymmetries. Local generation in the hydro-rich Idaho Power Company has embodied emissions of only 71kg/MW-hr, while its imports, coming primarily from Rocky Mountain states, have a carbon content of 625kg/MW-hr.

The reliance on hydropower also makes the asymmetry seasonal. Local generation is highest in the spring as snow melts, but imports become a larger source outside this time of year. As solar and wind can also have pronounced seasonal shifts, similar changes will likely be seen as these become larger contributors to many of these regional grids. Similar things occur daily, as both demand and solar production (and, to a lesser extent, wind) have distinct daily profiles.

The Golden State
California's CISO provides another instructive case. Imports represent less than 30% of its total electric use in 2016, yet California electricity imports provided 40% of its embodied emissions. Some of these, however, come internally from California, provided by the Los Angeles Department of Water and Power. The state itself, however, has only had limited tracking of imported emissions, lumping many of its sources as "other," and has been exporting its energy policies to Western states in ways that shape regional markets.

Overall, the 2016 inventory provides a narrow picture of the US grid, as plenty of trends are rapidly changing our country's emissions profile, including the rise of renewables and the widespread adoption of efficiency measures and other utility trends in 2017 that continue to evolve. The method developed here can, however, allow for annual updates, providing us with a much better picture of trends. That could be quite valuable to track things like how the rapid rise in solar power is altering the daily production of clean power.

More significantly, it provides a basis for more informed policymaking. States that wish to promote low-emissions power can use the information here to either alter the source of their imports or to encourage the sites where they're produced to adopt more renewable power. And those states that are exporting electricity produced primarily through fossil fuels could ensure that the locations where the power is used pay a price that includes the health costs of its production.


Related News

View more

U.S. Residents Averaged Fewer Power Outages in 2022

2022 U.S. Power Outage Statistics show lower SAIDI as fewer major events hit, with SAIFI trends, electric reliability, outage duration and frequency shaped by hurricanes, winter storms, vegetation, and utility practices across states.


Key Points

They report SAIDI and SAIFI for 2022, showing outage duration, frequency, and impacts of major weather events.

✅ 2022 SAIDI averaged 5.6 hours; SAIFI averaged 1.4 interruptions.

✅ Fewer major events lowered outage duration versus 2021.

✅ Hurricanes and winter storms drove long outages in several states.


In 2022, U.S. electricity consumers on average experienced about 5.5 hours of power disruptions, a decrease from nearly two hours compared to 2021. This information comes from the latest Annual Electric Power Industry Report. The reduction in yearly power interruptions primarily resulted from fewer significant events in 2022 compared to the previous year, and utility disaster planning continues to support grid resilience as severe weather persists.

Since 2013, excluding major events, the annual average duration of power interruptions has consistently hovered around two hours. Factors contributing to major power disruptions include weather-related incidents, vegetation interference near power lines, and specific utility practices, while pandemic-related grid operations influenced workforce planning more than outage frequency. To assess the reliability of U.S. electric utilities, two key indexes are utilized:

  • The System Average Interruption Duration Index (SAIDI) calculates the total length (in hours) an average customer endures non-brief power interruptions over a year.
  • The System Average Interruption Frequency Index (SAIFI) tracks the number of times interruptions occur.

The influence of major events on electrical reliability is gauged by comparing affected states' SAIDI and SAIFI values against the U.S. average, which was 5.6 hours of outages and 1.4 outages per customer in 2022. The year witnessed 18 weather-related disasters in the U.S., each resulting in over $1 billion in damages, and COVID-19 grid assessments indicated the electricity system was largely safe from pandemic impacts. Noteworthy major events include:

  • Hurricane Ian in September 2022, leaving over 2.6 million Floridian customers without electricity, with restoration in some areas taking weeks rather than days.
  • Hurricane Nicole in November 2022, causing over 300,000 Florida customers to lose power.
  • Winter Storm Elliott in December 2022, affecting over 1.5 million customers in multiple states including Texas where utilities struggled after Hurricane Harvey to restore service, and Florida, and bringing up to four feet of snow in parts of New York.

In 2022, states like Florida, West Virginia, Maine, Vermont, and New Hampshire experienced the most prolonged power interruptions, with New Hampshire averaging 10.3 hours and Florida 19.1 hours, and FPL's Irma storm response illustrates how restoration can take days or weeks in severe cases. Conversely, the District of Columbia, Delaware, Rhode Island, Nebraska, and Iowa had the shortest total interruptions, with the District of Columbia averaging just 34 minutes and Iowa 85 minutes.

The frequency of outages, unlike their duration, is more often linked to non-major events. Across the nation, Alaska recorded the highest number of power disruptions per customer (averaging 3.5), followed by several heavily forested states like Tennessee and Maine. Power outages due to falling tree branches are common, particularly during winter storms that burden tree limbs and power lines, as seen in a North Seattle outage affecting 13,000 customers. The District of Columbia stood out with the shortest and fewest outages per customer.


Related News

View more

Trudeau vows to regulate oil and gas emissions, electric car sales

Canada Oil and Gas Emissions Cap sets five-year targets to cut sector emissions toward net-zero by 2050, alongside an EV mandate, carbon pricing signals, and support for carbon capture, clean energy jobs, climate policy.


Key Points

A federal policy to regulate and reduce oil and gas emissions via 5-year targets, reaching net-zero by 2050.

✅ Regulated 5-year milestones to cut oil and gas emissions to net-zero by 2050

✅ Interim EV mandate: 50% by 2030; 100% zero-emission sales by 2035

✅ $2B fund for clean energy jobs in oil- and gas-reliant communities


Liberal Leader Justin Trudeau vowed to regulate total emissions from Canada’s oil and gas producers as he laid out his first major climate change promises of the campaign Sunday, a plan that was welcomed by several environmental and climate organizations.

Trudeau said that if re-elected, the Liberals will set out regulated five-year targets for emissions from oil and gas production to get them to net-zero emissions by 2050, a goal that, according to an IEA report will require more electricity, but also create a $2 billion fund to create jobs in oil and gas-reliant communities in Alberta, Saskatchewan and Newfoundland and Labrador.

“Let’s be realistic, over a quarter of Canada’s emissions come from our oil and gas sector. We need the leadership of these industries to decarbonize our country,” Trudeau said.

“That’s why we’ll make sure oil and gas emissions don’t increase and instead go down with achievable milestones,” while ensuring local economies can prosper.“

The Liberals are also introducing an interim electric vehicle mandate, which will require half the cars sold in Canada to be zero-emission by 2030, and because cleaning up electricity is critical to meeting climate pledges, the policy pairs with power-sector decarbonization, ahead of the final mandated target of 100 per cent by 2035.

Trudeau spoke in Cambridge, Ont., where protesters once again made an appearance amid a visible police presence. Officers carried one woman off the property when she refused to leave when asked.

Trudeau alluded to the protesters and their actions, which included sounding sirens and chanting expletives, as he defended his government’s record on climate change including progress in the electricity sector nationally, and touted its new plan.

“Sirens in the background may remind us that this is a climate emergency. That’s why we will move faster and be bolder,” he said.

Canada’s largest oilsands producers have already committed to reaching net zero greenhouse gas emissions by 2050, but the policy proposed Sunday “calls the oil companies’ bluff” by making those goals a legislated requirement, said Keith Stewart, senior energy strategist with Greenpeace Canada.

The new timeline for electric vehicles also “sends a clear signal to auto companies to get cracking (and build them here),” he said on Twitter, even as proposals like a fully renewable grid by 2030 are debated today. “We’d like to see this happen faster but the shift away from voluntary targets to requirements is big.”


Merran Smith, executive director of Clean Energy Canada, a climate program at Simon Fraser University, said clean electricity, clean transportation and “phasing out oil and gas with accountable milestones” must be key priorities over the next decade, aligning with Canada’s race to net-zero and the role of renewable energy.

“Today’s announcement, which checks all of these boxes, is not just good ambition_it’s good policy. Policy that will drive down carbon pollution and drive up clean job growth and economic competitiveness. It is policy that will drive Canada forward with cleaner cars, power Canada with clean electricity, and invest in businesses that will last such as battery manufacturing, electric vehicle manufacturing and low carbon steel,” Smith said in an email.

Michael Bernstein, executive director of the climate policy organization Clean Prosperity, said the promises laid out Sunday offer a “strong boost” to the federal government’s previous climate commitments.

He said the organization prefers market incentives such as carbon pricing, that spur innovation over further regulation. But since the largest oilsands companies have already committed to reaching net-zero emissions, he said the newly unveiled policy could provide some support.

“ First, I would encourage the Liberal Party to release independent modelling showing the types of emissions reductions they expect to achieve with their new package of policies. Second, many policies are referred to in general terms so I hope the Liberal Party will provide further details in the coming days,” he said.

“Finally, the document does not specifically mention carbon capture or carbon dioxide removal technologies but both technologies will be critical to achieve some of the pledges in today’s announcement, especially reaching net-zero emissions in the oil a gas sector.”

NDP Leader Jagmeet Singh painted the announcement as the latest in a string of “empty promises” from the Liberals on climate change, saying Canada has the highest increase in greenhouse gas emissions among all G7 countries, and that provinces like B.C. risk missing 2050 targets as well, he argued.

“Climate targets mean nothing when you don’t act on them. We can’t afford more of Justin Trudeau’s empty words on climate change,” he said in a statement.

The Trudeau Liberals submitted new targets to the United Nations in July, promising that Canada will curb emissions by 40 to 45 per cent from 2005 levels by 2030, building on the net-zero by 2050 plan announced earlier, officials say.


Related News

View more

Sign Up for Electricity Forum’s Newsletter

Stay informed with our FREE Newsletter — get the latest news, breakthrough technologies, and expert insights, delivered straight to your inbox.

Electricity Today T&D Magazine Subscribe for FREE

Stay informed with the latest T&D policies and technologies.
  • Timely insights from industry experts
  • Practical solutions T&D engineers
  • Free access to every issue

Live Online & In-person Group Training

Advantages To Instructor-Led Training – Instructor-Led Course, Customized Training, Multiple Locations, Economical, CEU Credits, Course Discounts.

Request For Quotation

Whether you would prefer Live Online or In-Person instruction, our electrical training courses can be tailored to meet your company's specific requirements and delivered to your employees in one location or at various locations.