Protective Relay Training - Basic
Our customized live online or in‑person group training can be delivered to your staff at your location.

- Live Online
- 12 hours Instructor-led
- Group Training Available
Regular Price:
$699
Coupon Price:
$599
LOS ANGELES
—
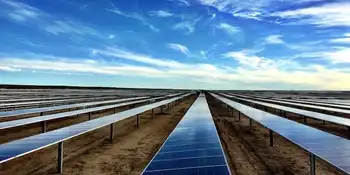
CAISO Net Negative Emissions signal moments when greenhouse gas intensity of serving ISO demand drops below zero, driven by high renewable generation, low load, strong solar exports, and imports accounting in the California grid.
What This Means
Moments when CAISO's CO2 to serve demand is below zero, driven by renewables, exports, and import accounting.
Calculated using imports and exports to serve ISO demand
Occur during high solar output, low weekend load
Coincide with curtailment and record renewable penetration
We’re a long way from the land of milk and honey, but on Easter Sunday – for about an hour – we got a taste.
On Sunday, at 1:55 PM Pacific Time the California Independent Systems Operator (CAISO) reported that greenhouse gas emissions necessary to serve its demand (~80% of California’s electricity demand on an annual basis), was measured at a rate -16 metric tons of CO2 per hour. Five minutes later, the value was -2 mTCO2/h, before it crept back up to 40 mTCO2/h at 2:05 PM PST. At 2:10 PST though it fell back to -86 mTCO2/h and stayed negative until 3:05 PM PST, even as global CO2 emissions flatlined in 2019 according to the IEA.
This information was brought to the attention of pv magazine via tweet from eagle eye Jon Pa after CAISO’s site first noted the negative values:
The region was still generating CO2 though, as natural gas, biogas, biomass, geothermal and even coal plants were running and pumping out emissions, even as potent greenhouse gases declined in the US under control efforts. CAISO’s Greenhouse Gas Emission Tracking Methodology, December 28, 2016 (pdf) notes the below calculations to create the value what it terms, “Total GHG emissions to serve ISO demand”:
Of importance to note is that to get to the net negative value, CAISO considered all electricity imports and exports, a reminder that climate policy shapes grid operations across North America. And as can be noted in the image below the CO2 intensity of imports during the day rapidly declined as the sun came up, first going negative around 9:05 AM PST, and mostly staying so until just before 6 PM PST.
During this same weekend, other records were noted (reiterating that we’re in record setting season and as the state pursues its 100% carbon-free mandate now in law) such as a new electricity export record of greater than 2 GW and total renewable electricity as part of total demand at greater than 70%.
At the peak negative moment of 2:15 PM PST, -112 mTCO2/h seen below, the total amount of clean instantaneous generation being used in the power grid region was 17 GW, a far cry from heat-driven reliability strains like rolling blackout warnings that arise during extreme demand, with renewables giving 76% of the total, hydro 14%, nuclear 13% and imports of -12% countering the CO2 coming from just over 1.4 GW of gas generation.
Also of importance are a few layers of nuance in the electricity demand charts. First off we’re in the shoulder seasons of California – nice cool weather before the warmth of summer drives air conditioning demand. Additional the weekend electricity demand is always lower, as well, Easter Sunday might have had an affect, whereas in colder regions Calgary’s electricity use can soar during frigid snaps.
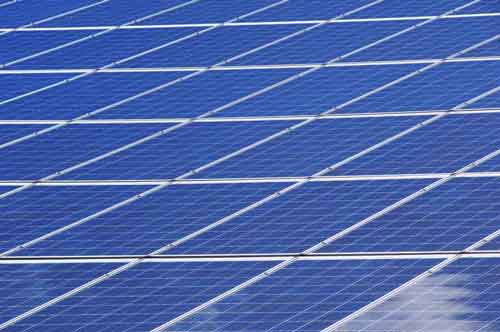
Lastly to note was the amount of electricity from solar and wind generation being curtailed. And while the Sunday numbers weren’t available yet, the below image noted Saturday with 10 GWh in total being curtailed (pdf) – peaking at over 3.2 GW of instantaneous mostly solar power even as solar is now the cheapest electricity according to the IEA, in the hours of 2 and 3 PM PST. On an annualized basis, less than 2% of total potential solar electricity was curtailed in 2018.
Related News

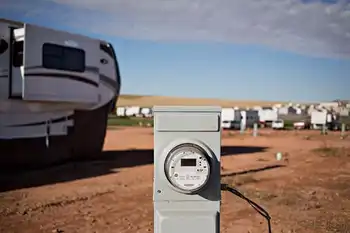
EU Smart Meters Spur Growth in the Customer Analytics Market
EU Smart Meter Analytics integrates AMI data with grid edge platforms, enabling back-office efficiency, revenue…
View more
New York Achieves Solar Energy Goals Ahead of Schedule
New York Solar Milestone accelerates renewable energy adoption, meeting targets early with 8,000 MW capacity…
View more
New Rules for a Future Puerto Rico Microgrid Landscape
Puerto Rico Microgrid Regulations outline renewable energy, CHP, and storage standards, enabling islanded systems, PREPA…
View more

China's Fusion Reactor Targets Ignition by 2027
China's Experimental Advanced Superconducting Tokamak (EAST) is on track to achieve plasma ignition by 2027…
View more

Canada could be electric, connected and clean — if it chooses
Canada Clean Energy Transition accelerates via carbon pricing, renewables, EV incentives, energy efficiency upgrades, smart…
View more
Americans Keep Using Less and Less Electricity
U.S. Electricity Demand Decoupling signals GDP growth without higher load, driven by energy efficiency, LED…
View more
Sign Up for Electricity Forum’s Newsletter
Stay informed with our FREE Newsletter — get the latest news, breakthrough technologies, and expert insights, delivered straight to your inbox.
Electricity Today T&D Magazine Subscribe for FREE

Stay informed with the latest T&D policies and technologies.
- Timely insights from industry experts
- Practical solutions T&D engineers
- Free access to every issue

