OPG appoints nuclear expert as new president

By Toronto Star


Protective Relay Training - Basic

Our customized live online or in‑person group training can be delivered to your staff at your location.

  • Live Online
  • 12 hours Instructor-led
  • Group Training Available
Regular Price:
$699
Coupon Price:
$599
Reserve Your Seat Today
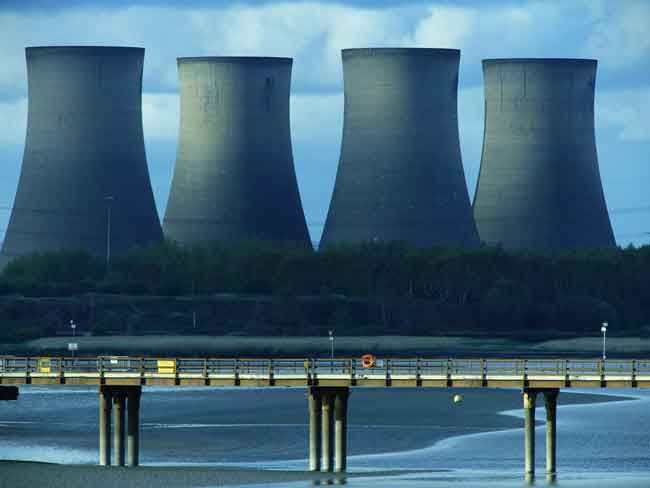
Ontario Power Generation has named Tom Mitchell as president, the energy agency's first internal appointment in almost 20 years.

Mitchell is currently OPG's chief nuclear officer and takes over the top post July 1.

He replaces Jim Hankinson, who is retiring after four years as OPG's president and chief executive.

OPG is a provincial Crown-owned utility company that generates and sells electricity.

Energy Minister George Smitherman said he was happy with the appointment, adding it recognizes the progress the company has been making.

Up until recently, OPG had been run by political appointees.

"I don't think it's about a move away from politics, but when you can hire an internal candidate it's recognition that the organization is functioning well and that there's a capacity to bring leaders up through the ranks," Smitherman said.

"This is an organization which is going through a lot of change."

The last internal OPG employee to be appointed as president was Al Holt in 1991.

Mitchell has been in charge nuclear since 2006, and was previously responsible for the operation of the four Pickering B nuclear reactors east of Toronto.

Related News

Bruce Power cranking out more electricity after upgrade

Bruce Power Capacity Uprate boosts nuclear output through generator stator upgrades, turbine and transformer enhancements, and cooling pump improvements at Bruce A and B, unlocking megawatts and efficiency gains from legacy heavy water design capacity.


Key Points

Upgrades that raise Bruce Power capacity via stator, turbine, transformer, and cooling enhancements.

✅ Generator stator replacement increases electrical conversion efficiency

✅ Turbine and transformer upgrades enable higher MW output

✅ Cooling pump enhancements optimize plant thermal performance


Bruce Power’s Unit 3 nuclear reactor will squeeze out an extra 22 megawatts of electricity, thanks to upgrades during its recent planned outage for refurbishment.

Similar gains are anticipated at its three sister reactors at Bruce A generating station, which presents the opportunity for the biggest efficiency gains and broader economic benefits for Ontario, due to a design difference over Bruce B’s four reactors, Bruce Power spokesman John Peevers said.

Bruce A reactor efficiency gains stem mainly from the fact Bruce A’s non-nuclear side, including turbines and the generator, was sized at 88 per cent of the nuclear capacity, Peevers said, while early Bruce C exploration work advances.

This allowed 12 per cent of the energy, in the form of steam, to be used for heavy water production, which was discontinued at the plant years ago. Heavy water, or deuterium, is used to moderate the reactors.

That design difference left a potential excess capacity that Bruce Power is making use of through various non-nuclear enhancements. But the nuclear operator, which also made major PPE donations during the pandemic, will be looking at enhancements at Bruce B as well, Peevers said.

Bruce Power’s efficiency gain came from “technology advancements,” including a “generator-stator improvement project that was integral to the uprate,” and contributed to an operating record at the site, a Bruce Power news release said July 11.

Peevers said the stationary coils and the associated iron cores inside the generator are referred to as the stator. The stator acts as a conductor for the main generator current, while the turbine provides the mechanical torque on the shaft of the generator.

“Some of the other things we’re working on are transformer replacement and cooling pump enhancements, backed by recent manufacturing contracts, which also help efficiency and contribute to greater megawatt output,” Peevers said.

The added efficiency improvements raised the nuclear operator’s peak generating capacity to 6,430 MW, as projects like Pickering life extensions continue across Ontario.


Related News

View more

COVID-19 Pandemic Puts $35 Billion in Wind Energy Investments at Risk, Says Industry Group

COVID-19 Impact on U.S. Wind Industry: disrupting wind power projects, tax credits, and construction timelines, risking rural revenues, jobs, and $35B investments; AWEA seeks Congressional flexibility as OEM shutdowns like Siemens Gamesa intensify delays.


Key Points

Pandemic disruptions threaten 25 GW of projects, $35B investment, rural revenues, jobs, and tax-credit timelines.

✅ 25 GW at risk; $35B investment jeopardized

✅ Rural taxes and land-lease payments may drop $8B

✅ AWEA seeks Congressional flexibility on tax-credit deadlines


In one of the latest examples of the havoc that the novel coronavirus is wreaking on the U.S. economy and the crisis hitting solar and wind sector alike, the American Wind Energy Association (AWEA) -- the national trade association for the U.S. wind industry -- yesterday stated its concerns that COVID-19 will "pose significant challenges to the American wind power industry." According to AWEA's calculations, the disease is jeopardizing the development of approximately 25 gigawatts of wind projects, representing $35 billion in investments, even as wind additions persist in some markets amid the pandemic.

Rural communities, where about 99% of wind projects are located, in particular, face considerable risk. The AWEA estimates that rural communities stand to lose about $8 billion in state and local tax payments and land-lease payments to private landowners. In addition, it's estimated that the pandemic threatens the loss of over 35,000 jobs, and the U.S. wind jobs outlook underscores the stakes, including wind turbine technicians, construction workers, and factory workers.

The development of wind projects is heavily reliant on the earning of tax credits, and debates over a Solar ITC extension highlight potential impacts on wind. However, in order to qualify for the current credits, project developers are bound to begin construction before Dec. 31, 2020. With local and state governments implementing various measures to stop the spread of the virus, the success of project developers' meeting this deadline is dubious, as utility-scale solar construction slows nationwide due to COVID-19. Addressing this and other challenges, the AWEA is turning to the government for help. In the trade association's press release, it states that "to protect the industry and these workers, AWEA is asking Congress for flexibility in allowing existing policies to continue working for the industry through this period of uncertainty."

Illustrating one of the ways in which COVID-19 is affecting the industry, Siemens Gamesa, a global leader in the manufacturing of wind turbines, closed a second Spanish factory this week after learning that a second of its employees had tested positive for the novel coronavirus.


Related News

View more

Geothermal Power Plant In Hawaii Nearing Dangerous Meltdown?

Geothermal Power Plant Risks include hydrogen sulfide leaks, toxic gases, lava flow hazards, well blowouts, and earthquake-induced releases at sites like PGV and the Geysers, threatening public health, grid reliability, and environmental safety.


Key Points

Geothermal Power Plant Risks include toxic gases, lava impacts, well failures, and induced quakes that threaten health.

✅ Hydrogen sulfide exposure can cause rapid pulmonary edema.

✅ Lava can breach wells, venting toxic gases into communities.

✅ Induced seismicity may disrupt grids near PGV and the Geysers.


If lava reaches Hawaii’s PGV geothermal power plant, it could release of deadly hydrogen sulfide gas. That’s the latest potential danger from the Kilauea volcanic eruption in Hawaii. Residents now fear that lava flow will trigger a meltdown at the Puna Geothermal Venture (PGV) power plant that would release even more toxic gases into the air.

Nobody knows what will happen if lava engulfs the PGV because magma has never engulfed a geothermal power plant, Reuters reported. A geothermal power plant uses steam and gas heated by lava deep in the earth to run turbines that make electricity.

The PGV power plant produces 25% of the power used on Hawaii’s “Big Island.” The plant is considered a source of clean energy because geothermal plants burn no fossil fuels and produce little pollution under normal circumstances, even as nuclear retirements like Three Mile Island reshape low-carbon options.


The Potential Danger from Geothermal Energy

The fear is that the lava would release chemicals used to make electricity at the plant. The PGV has been shut down and authorities moved an estimated 60,000 gallons of flammable liquids away from the facility. They also shut down wells that extract steam and gas used to run the turbines.

Another potential danger is that lava would open the wells and release clouds of toxic gases from them. The wells are typically sealed to prevent the gas from entering the atmosphere.

The most significant threat is hydrogen sulfide, a highly toxic and flammable gas that is colorless. Hydrogen sulfide normally has a rotten egg smell which people might not detect when the air is full of smoke. That means people can breathe hydrogen sulfide in without realizing they have been exposed.

The greatest danger from hydrogen sulfide is pulmonary edema; the accumulation of fluid in the lungs, which causes a person to stop breathing. People have died of pulmonary edema after just a few minutes of exposure to hydrogen sulfide gas. Many victims become unconscious before the gas kills them. Long-term dangers that survivors of pulmonary edema face include brain damage.

Hydrogen sulfide can also cause burns to the skin that are similar to frostbite. Persons exposed to hydrogen sulfide can also suffer from nausea, headaches, severe eye burns, and delirium. Children are more vulnerable to hydrogen sulfide because it is a heavy gas that stays close to the ground.


Geothermal Danger Extends Far Beyond Hawaii

The danger from geothermal energy extends far beyond Hawaii. The world’s largest collection of geothermal power plants is located at the Geysers in California’s Wine Country, and regulatory timelines such as the postponed closure of three Southern California plants can affect planning.

The Geysers field contains 350 steam production wells and 22 power plants in Sonoma, Lake, and Mendocino counties. Disturbingly, the Geysers are located just north of the heavily-populated San Francisco Bay Area and just west of Sacramento, where preemptive electricity shutdowns have been used during extreme fire weather. Problems at the Geysers might lead to significant blackouts because the field supplies around 20% of the green energy used in California.

Another danger from geothermal power is earthquakes because many geothermal power plants inject wastewater into hot rock deep below to produce steam to run turbines, a factor under review as SaskPower explores geothermal in new settings. A geothermal project in Switzerland created Earthquakes by injecting water into the Earth, Zero Hedge reported. A theoretical threat is that quakes caused by injection would cause the release of deadly gases at a geothermal power plant.

The dangers from geothermal power might be much greater than its advocates admit, potentially increasing reliance on natural-gas-based electricity during supply shortfalls.


Related News

View more

Atlantica - Regulatory Reform To Bring Greener Power To Atlantic Canada

Atlantic Canada Energy Regulatory Reform accelerates smart grids, renewables, hydrogen, and small modular reactors to meet climate targets, enabling interprovincial transmission, EV charging, and decarbonization toward a net-zero grid by 2035 with agile, collaborative policies.


Key Points

A policy shift enabling smart grids, clean energy, and transmission upgrades to decarbonize Atlantic Canada by 2035.

✅ Agile rules for smart grids, EV load, and peak demand balancing

✅ Interprovincial transmission: Maritime Link, NB-PEI, Atlantic Loop

✅ Supports hydrogen, SMRs, and renewables to cut GHG emissions


Atlantica Centre for Energy Senior Policy Consultant Neil Jacobsen says the future of Atlantic Canada’s electricity grid depends on agile regulations, supported by targeted research such as the $2M Atlantic grid study, that match the pace at which renewable technologies are being developed in the race to meet Canada’s climate goals.

In an interview, Jacobsen stressed the need for a more modernized energy regulatory framework, so the Atlantic Provinces can collaborate to quickly develop and adopt cleaner energy.

To this end, Atlantica released a paper that makes the case for responsive smart grid technology, the adaptation of alternative forms of clean energy, the adaptation of hydrogen as an energy source, petroleum price regulation in Atlantic Canada and small modular reactors.

Jacobsen said regulations need to match Canada’s urgency around reducing greenhouse gas emissions by 40 to 45 percent by 2030, achieving a net-neutral national power grid by 2035 and ultimately a net-zero grid by 2050 in Canada – and the goal that 50 percent of Canadian vehicle sales being electric by 2030.

“It’s an evolution of policy and regulations to adapt to a very aggressive timeline of aggressive climate change and decarbonization targets,” said Jacobsen.

“These are transformational energy and environmental commitments, so the path forward really requires the ability to introduce and adapt and move forward with new clean renewable energy technologies.”

Jacobsen said Atlantica’s recommendations are not a criticism of existing regulations– but an acknowledgment that they need to evolve.

He noted newer, clearer regulations will make way for new energy sources – particularly a region that has the countries highest rates of dependency on fossil fuels and growing climate risks, with Atlantic grids under threat from more intense storms.

“We have a long way to go, but at the same time, we have a lot to celebrate. Atlantic Canada is leading the country in reducing greenhouse gas emissions,” said Jacobsen.

“There are new ways of producing energy that requires us to be able to be much more responsive and this is an opportunity to create a higher level of alignment here, in Atlantic Canada.”

Jacobsen said Atlantica is looking to aid interprovincial cooperation in providing power, echoing calls for a western Canadian grid elsewhere, through projects like the 500-megawatt, 170-kilometre Maritime Link that transports power from the Muskrat Falls hydroelectric dam in Labrador, through Newfoundland and across the Cabot Strait, to Nova Scotia – or NB Power’s export of electricity to P.E.I., via sub-sea cables crossing the Northumberland Strait.

He noted streamlined regulations may allow for more potential wider-scale partnerships, like the proposed Atlantic Loop project, aligning with macrogrid investments that would involve upgrading transmission capacity on the East Coast to allow hydroelectric power from Labrador and Quebec to displace coal use in the region.

Atlantic Canada has led the way with adaption new renewable technologies, noted Jacobsen, referring to nuclear startups Moltex Energy and ARC Nuclear Canada’s efforts to develop small modular nuclear reactor technology in New Brunswick, as well as the potential of adopting hydrogen fuel technology and Nova Scotia’s strides in developing offshore renewable energy.

“I don’t think we have any choice other than to be forceful and aggressive in driving forward a renewable energy agenda.”

Jacobsen said cooperation between the Atlantic provinces is crucial because of how challenging it is to meet energy demand with heavy seasonal and daily variations in energy demand in the region – something smart grid technology could address.

Smart Grid Atlantic is a four-year research and demonstration program testing technologies that provide cleaner local power, support a smarter electricity infrastructure across the region, more renewable power, more information and control over power use and more reliable electricity.

“It can be challenging for utilities to meet those cyclical demands, especially as grids are increasingly exposed to harsh weather across Canada. Smart girds add knowledge of the flow of electrons in a way that can help even out those electricity demands – and quite frankly, those demands will only increase when you look at the electrification of the transportation sector,” he said.

Jacobsen said Atlantica’s paper and call for modernized regulations are only the beginning of a conversation.


Related News

View more

Which of the cleaner states imports dirty electricity?

Hourly Electricity Emissions Tracking maps grid balancing areas, embodied emissions, and imports/exports, revealing carbon intensity shifts across PJM, ERCOT, and California ISO, and clarifying renewable energy versus coal impacts on health and climate.


Key Points

An hourly method tracing generation, flows, and embodied emissions to quantify carbon intensity across US balancing areas.

✅ Hourly traces of imports/exports and generation mix

✅ Consumption-based carbon intensity by balancing area

✅ Policy insights for renewables, coal, health costs


In the United States, electricity generation accounts for nearly 30% of our carbon emissions. Some states have responded to that by setting aggressive renewable energy standards; others are hoping to see coal propped up even as its economics get worse. Complicating matters further is the fact that many regional grids are integrated, and as America goes electric the stakes grow, meaning power generated in one location may be exported and used in a different state entirely.

Tracking these electricity exports is critical for understanding how to lower our national carbon emissions. In addition, power from a dirty source like coal has health and environment impacts where it's produced, and the costs of these aren't always paid by the parties using the electricity. Unfortunately, getting reliable figures on how electricity is produced and where it's used is challenging, even for consumers trying to find where their electricity comes from in the first place, leaving some of the best estimates with a time resolution of only a month.

Now, three Stanford researchers—Jacques A. de Chalendar, John Taggart, and Sally M. Benson—have greatly improved on that standard, and they have managed to track power generation and use on an hourly basis. The researchers found that, of the 66 grid balancing areas within the United States, only three have carbon emissions equivalent to our national average, and they have found that imports and exports of electricity have both seasonal and daily changes. de Chalendar et al. discovered that the net results can be substantial, with imported electricity increasing California's emissions/power by 20%.

Hour by hour
To figure out the US energy trading landscape, the researchers obtained 2016 data for grid features called balancing areas. The continental US has 66 of these, providing much better spatial resolution on the data than the larger grid subdivisions. This doesn't cover everything—several balancing areas in Canada and Mexico are tied in to the US grid—and some of these balancing areas are much larger than others. The PJM grid, serving Pennsylvania, New Jersey, and Maryland, for example, is more than twice as large as Texas' ERCOT, in a state that produces and consumes the most electricity in the US.

Despite these limitations, it's possible to get hourly figures on how much electricity was generated, what was used to produce it, and whether it was used locally or exported to another balancing area. Information on the generating sources allowed the researchers to attach an emissions figure to each unit of electricity produced. Coal, for example, produces double the emissions of natural gas, which in turn produces more than an order of magnitude more carbon dioxide than the manufacturing of solar, wind, or hydro facilities. These figures were turned into what the authors call "embodied emissions" that can be traced to where they're eventually used.

Similar figures were also generated for sulfur dioxide and nitrogen oxides. Released by the burning of fossil fuels, these can both influence the global climate and produce local health problems.

Huge variation
The results were striking. "The consumption-based carbon intensity of electricity varies by almost an order of magnitude across the different regions in the US electricity system," the authors conclude. The low is the Bonneville Power grid region, which is largely supplied by hydropower; it has typical emissions below 100kg of carbon dioxide per megawatt-hour. The highest emissions come in the Ohio Valley Electric region, where emissions clear 900kg/MW-hr. Only three regional grids match the overall grid emissions intensity, although that includes the very large PJM (where capacity auction payouts recently fell), ERCOT, and Southern Co balancing areas.

Most of the low-emissions power that's exported comes from the Pacific Northwest's abundant hydropower, while the Rocky Mountains area exports electricity with the highest associated emissions. That leads to some striking asymmetries. Local generation in the hydro-rich Idaho Power Company has embodied emissions of only 71kg/MW-hr, while its imports, coming primarily from Rocky Mountain states, have a carbon content of 625kg/MW-hr.

The reliance on hydropower also makes the asymmetry seasonal. Local generation is highest in the spring as snow melts, but imports become a larger source outside this time of year. As solar and wind can also have pronounced seasonal shifts, similar changes will likely be seen as these become larger contributors to many of these regional grids. Similar things occur daily, as both demand and solar production (and, to a lesser extent, wind) have distinct daily profiles.

The Golden State
California's CISO provides another instructive case. Imports represent less than 30% of its total electric use in 2016, yet California electricity imports provided 40% of its embodied emissions. Some of these, however, come internally from California, provided by the Los Angeles Department of Water and Power. The state itself, however, has only had limited tracking of imported emissions, lumping many of its sources as "other," and has been exporting its energy policies to Western states in ways that shape regional markets.

Overall, the 2016 inventory provides a narrow picture of the US grid, as plenty of trends are rapidly changing our country's emissions profile, including the rise of renewables and the widespread adoption of efficiency measures and other utility trends in 2017 that continue to evolve. The method developed here can, however, allow for annual updates, providing us with a much better picture of trends. That could be quite valuable to track things like how the rapid rise in solar power is altering the daily production of clean power.

More significantly, it provides a basis for more informed policymaking. States that wish to promote low-emissions power can use the information here to either alter the source of their imports or to encourage the sites where they're produced to adopt more renewable power. And those states that are exporting electricity produced primarily through fossil fuels could ensure that the locations where the power is used pay a price that includes the health costs of its production.


Related News

View more

Website Providing Electricity Purchase Options Offered Fewer Choices For Spanish-speakers

Texas PUC Spanish Power to Choose mandates bilingual parity in deregulated electricity markets, ensuring equal access to plans, transparent pricing, consumer protection, and provider listings for Spanish speakers, mirroring the English site offerings statewide.


Key Points

PUC mandate requiring identical Spanish and English plan listings for fair access in the deregulated power market.

✅ Orders parity across English and Spanish plan listings

✅ Increases transparency in a deregulated electricity market

✅ Deadline set for providers to post on both sites


The state’s Public Utility Commission has ordered that the Spanish-language version of the Power to Choose website provide the same options available on the English version of the site, a move that comes as shopping for electricity is getting cheaper statewide.

Texas is one of a handful of states with a deregulated electricity market, with ongoing market reforms under consideration to avoid blackouts. The idea is to give consumers the option to pick power plans that they think best fit their needs. Customers can find available plans on the state’s Power To Choose website, or its Spanish-language counterpart, Poder de Escoger. In theory, those two sites should have the exact same offerings, so no one is disadvantaged. But the Texas Public Utility Commission found that wasn’t the case.

Houston Chronicle business reporter Lynn Sixel has been covering this story. She says the Power to Choose website is important for consumers facing the difficult task of choosing an electric provider in a deregulated state, where electricity complaints have recently reached a three-year high for Texans.

“There are about 57 providers listed on the [English] Power to Choose website, and news about retailers like Griddy underscores how varied the offerings can be across providers. [Last week] there were only 23 plans on the Spanish Power to Choose site,” Sixel says. “If you speak Spanish and you’re looking for a low-cost plan, as of last week, it would have been difficult to find some of the really great offers.”

Mustafa Tameez, managing director of Outreach Strategists, a Houston firm that consults with companies and nonprofits on diversity, described this issue as a type of redlining.

“He’s referring to a practice that banks would use to circle areas on maps in which the bank decided they did not want to lend money or would charge higher rates,” Sixel says. “Typically it was poor minority neighborhoods. Those folks would not get the same great deals that their Anglo neighbors would get.”

DeAnn Walker, chairman of the Public Utility Commission, said she was not at all happy about the plans listings in a meeting Friday, against a backdrop where Texas utilities have recently backed out of a plan to create smart home electricity networks.

“She gave a deadline of 8 a.m. Monday morning for any providers who wanted to put their plans on the Power to Choose website, must put them on both the Spanish language and the English language versions,” Sixel says. “All the folks that I talked to really had no idea that there were different plans on both sites and I think that there was sort of an assumption.”


Related News

View more

Sign Up for Electricity Forum’s Newsletter

Stay informed with our FREE Newsletter — get the latest news, breakthrough technologies, and expert insights, delivered straight to your inbox.

Electricity Today T&D Magazine Subscribe for FREE

Stay informed with the latest T&D policies and technologies.
  • Timely insights from industry experts
  • Practical solutions T&D engineers
  • Free access to every issue

Download the 2025 Electrical Training Catalog

Explore 50+ live, expert-led electrical training courses –

  • Interactive
  • Flexible
  • CEU-cerified