California Grid Transition drives decarbonization with renewable energy, EV charging, microgrids, and energy storage, while tackling wildfire risk, aging infrastructure, and cybersecurity threats to build grid resilience and reliability across a rapidly electrifying economy.
Key Points
California Grid Transition is the statewide shift to renewables, storage, EVs, and resilient, secure infrastructure.
✅ Integrates solar, wind, storage, and demand response at scale
✅ Expands microgrids and DERs to enhance reliability and resilience
✅ Addresses wildfire, aging assets, and cybersecurity risks
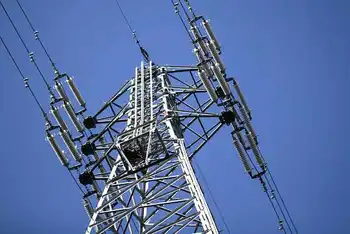
Gretchen Bakke thinks a lot about power—the kind that sizzles through a complex grid of electrical stations, poles, lines and transformers, keeping the lights on for tens of millions of Californians who mostly take it for granted.
They shouldn’t, says Bakke, who grew up in a rural California town regularly darkened by outages. A cultural anthropologist who studies the consequences of institutional failures, she says it’s unclear whether the state’s aging electricity network and its managers can handle what’s about to hit it, as U.S. blackout risks continue to mount.
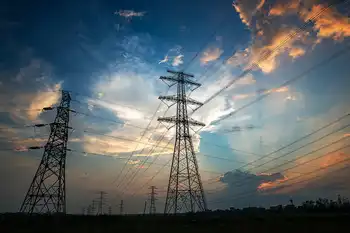
California is casting off fossil fuels to become something that doesn’t yet exist: a fully electrified state of 40 million people. Policies are in place requiring a rush of energy from renewable sources such as the sun and wind and calling for millions of electric cars that will need charging—changes that will tax a system already fragile, unstable and increasingly vulnerable to outside forces.
“There is so much happening, so fast—the grid and nearly everything about energy is in real transition, and there’s so much at stake,” said Bakke, who explores these issues in a book titled simply, “The Grid.”
The state’s task grew more complicated with this week’s announcement that Pacific Gas and Electric, which provides electricity for more than 5 million customer accounts, intends to file for bankruptcy in the face of potentially crippling liabilities from wildfires. But the reshaping of California’s energy future goes far beyond the woes of a single company.
The 19th-century model of one-way power delivery from utility companies to customers is being reimagined. Major utilities—and the grid itself—are being disrupted by rooftops paved with solar panels and the rise of self-sufficient neighborhood mini-grids. Whole cities and counties are abandoning big utilities and buying power from wholesalers and others of their choosing.
With California at the forefront of a new energy landscape, officials are racing to design a future that will not just reshape power production and delivery but also dictate how we get around and how our goods are made. They’re debating how to manage grid defectors, weighing the feasibility of an energy network that would expand to connect and serve much of the West and pondering how to appropriately regulate small power producers.
“We are in the depths of the conversation,” said Michael Picker, president of the state Public Utilities Commission, who cautions that even as the system is being rebooted, like repairing a car while driving in practice, there’s no real plan for making it all work.
Such transformation is exceedingly risky and potentially costly. California still bears the scars of having dropped its regulatory reins some 20 years ago, leaving power companies to bilk the state of billions of dollars it has yet to completely recover. And utility companies will undoubtedly pass on to their customers the costs of grid upgrades to defend against natural and man-made threats.
Some weaknesses are well known—rodents and tree limbs, for example, are common culprits in power outages, even as longer, more frequent outages afflict other parts of the U.S. A gnawing squirrel squeezed into a transformer on Thanksgiving Day three years ago, shutting off power to parts of Los Angeles International Airport. The airport plans to spend $120 million to upgrade its power plant.
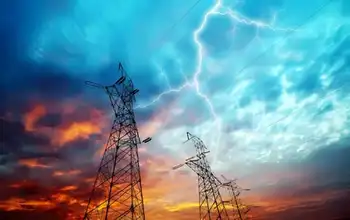
But the harsh effects of climate change expose new vulnerabilities. Rising seas imperil coastal power plants. Electricity infrastructure is both threatened by and implicated in wildfires. Picker estimates that utility operations are related to one in 10 wildland fires in California, which can be sparked by aging equipment and winds that send tree branches crashing into power lines, showering flammable landscapes with sparks.
California utilities have been ordered to make their lines and equipment more fire-resistant as they’re increasingly held accountable for blazes they cause. Pacific Gas and Electric reported problems with some of its equipment at a starting point of California’s deadliest wildfire, which killed at least 86 people in November in the town of Paradise. The cause of the fire is under investigation.
New and complex cyber threats are more difficult to anticipate and even more dangerous. Computer hackers, operating a world away, can—and have—shut down electricity systems, toggling power on and off at will, and even hijacked the computers of special teams dispatched to restore control.
Thomas Fanning, CEO of Southern Co., one of the country’s largest utilities, recently disclosed that his teams have fended off multiple attempts to hack a nuclear power plant the firm operates. He called grid hacking “the most important under-reported war in American history.”
However, if you’ve got what seems like an insoluble problem requiring a to-the-studs teardown and innovative rebuild, California is a good place to start. After all, the first electricity grid was built in San Francisco in 1879, three years before Thomas Edison’s power station in New York City. (Edison’s plant burned to the ground a decade later.)
California’s energy-efficiency regulations have helped reduce statewide energy use, which peaked a decade ago and is on the decline, somewhat easing pressure on the grid. The major utilities are ahead of schedule in meeting their obligation to obtain power from renewable sources.
California’s universities are teaming with national research labs to develop cutting-edge solutions for storing energy produced by clean sources. California is fortunate in the diversity of its energy choices: hydroelectric dams in the north, large-scale solar operations in the Mojave Desert to the east, sprawling windmill farms in mountain passes and heat bubbling in the Geysers, the world’s largest geothermal field north of San Francisco. A single nuclear-power plant clings to the coast near San Luis Obispo, but it will be shuttered in 2025.
But more renewable energy, accessible at the whims of weather, can throw the grid off balance. Renewables lack the characteristic that power planners most prize: dispatchability, ready when called on and turned off when not immediately needed. Wind and sun don’t behave that way; their power is often available in great hunks—or not at all, as when clouds cover solar panels or winds drop.
In the case of solar power, it is plentiful in the middle of the day, at a time of low demand. There’s so much in California that most days the state pays its neighbors to siphon some off, lest the excess impede the grid’s constant need for balance—for a supply that consistently equals demand.
So getting to California’s new goals of operating on 100 percent clean energy by 2045 and having 5 million electric vehicles within 12 years will require a shift in how power is acquired and managed. Consumers will rely more heavily on battery storage, whose efficiency must improve to meet that demand.
Related News