The wind versus nuclear debate
By Toronto Star
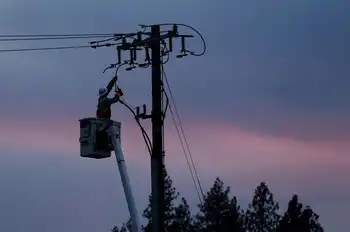
Substation Relay Protection Training
Our customized live online or in‑person group training can be delivered to your staff at your location.

- Live Online
- 12 hours Instructor-led
- Group Training Available
But advocates of renewable energy say the comparison doesn't acknowledge huge subsidies that nuclear receives from electricity ratepayers.
It's a debate that's only liken to sharpen as a provincial election nears, the Liberal government defends its renewable power push and Ontario Power Generation moves forward on its proposal for new nuclear reactors.
Performing the analysis of replacing nuclear reactors with wind turbines is Bruce Sharp of Aegent Energy Advisors.
Sharp concedes that it is a theoretical exercise: "No one could seriously propose replacing all of Ontario's nuclear power exclusively with wind."
Green power advocates who hate nuclear would replace it with a combination of renewable sources — including solar and hydro power as well as wind — plus aggressive conservation programs and some high efficiency gas-fired generation.
But Sharp states the case to demonstrate that bringing in massive amounts of renewable power isn't as simple as it seems.
Here's an outline of the thinking:
In 2010, Ontario nuclear plants churned out 82.8 billion kilowatt hours of power. That meant the province's 10,500 megawatts of nuclear generation capacity ran on average about 90 per cent of the time.
Replacing that with wind power is complicated, because in Ontario the wind is variable. On average it runs at 27.8 per cent capacity, Sharp figures. That means that if a turbine could theoretically produce 100 megawatt hours of electricity if it ran flat-out, without stopping all year round, under actual wind conditions it would only produce 27.8 megawatt hours.
Hence, replacing the nuclear output with wind turbines that have a capacity of 27.8 per cent would require 34,000 megawatts of generating capacity.
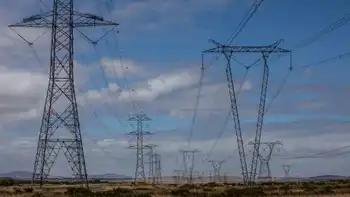
The turbines would cover 14,200 square kilometres of territory — that's a square with sides of almost 120 kilometres.
Wind also requires back-up generation: Sometimes there is no wind at all, but residents and businesses still need power. Building enough natural gas-fired plants to back up the turbines, and buying gas to fuel them, would cost $1.92 billion a year in capital and extra operating costs, Sharp figures.
Occasionally, wind will also over-produce, blowing hard when there is little demand and producing surplus power as has happened on several occasions this year.
There's a cost to selling surplus power at a loss, and a cost in building new transmission lines to service widely dispersed wind farms.
Putting all of these theoretical costs together, Sharp figures that replacing nuclear with wind, and building the gas-fuelled back-up, would cost the power system an extra $7.7 billion a year. That, he calculates, would translate into an increase of 5.6 cents a kilowatt hour on the power bills of most Ontario consumers.
For a household using 800 kilowatt hours of power a year, the increase including GST would be $632 a year, Sharp figures.
Sounds grim. Let's stick with nuclear.
Except that the economics of nuclear are not necessarily all that they appear to be, either, its detractors argue.
Nuclear, too, gets a special deal from ratepayers in the form of special contracts that currently are considerably higher than the spot market price.
Consider that the average spot price of power on Ontario's electricity market in 2010 was 3.79 cents a kilowatt hour and only 3.16 cents in 2009.
Ontario Power Generation sells its nuclear output for a contracted price of 5.6 cents a kilowatt hour.
Bruce Power has a more complicated arrangement. The output from its Bruce A station — in which two of four units are still undergoing a refurbishment that is years behind schedule and far over budget — fetches 7.2 cents a megawatt hour according to the Ontario Energy Board.
Output from the Bruce B plant is supported by a floor price of 5.1 cents a kilowatt hour. Since the average market price has been below the floor price, it has triggered substantial payments.
Keith Stewart of Greenpeace estimates that payments under the floor price may have totaled as much as $250 million in 2010.
The Ontario Power Authority and Bruce Power said the payments are confidential and wouldn't comment.
The OPA releases only a global total of what it pays to all generators who have contractual deals‚ which includes nuclear operators, gas-fired generators and renewable power generators such as gas, wind and solar.
Most of those contracts pay prices higher than the average market price.
The total payout for all the contracts was $1.62 billion in 2010, up from $1.4 billion in 2009.
Consumers make up the difference through an extra charge called the "global adjustment" or "provincial benefit," which is adjusted monthly, and now often equals or exceeds the actual energy price of electricity.
On May 5 at 9 a.m., for example, the hourly electricity price was 3.25 cents a kilowatt hour the global adjustment was 4.3 cents.
Premium prices being paid for renewable energy are often blamed for Ontario's rising power prices, Stewart says.
But he argues that they're not the chief culprit.
"It's these types of nuclear top-ups, and to a lesser extent gas contracts, that's actually driving the provincial benefit," Stewart contends.
And new-build nuclear plants will require even higher prices if they are going to cover their costs, he says.