Substation Relay Protection Training
Our customized live online or in‑person group training can be delivered to your staff at your location.

- Live Online
- 12 hours Instructor-led
- Group Training Available
Regular Price:
$699
Coupon Price:
$599
ATLANTA
—
Vogtle Unit 3 Initial Criticality marks the startup of a new U.S. nuclear reactor, initiating fission to produce heat, steam, and electricity, supporting clean energy goals, grid reliability, and carbon-free baseload power.
The Latest Developments
Vogtle Unit 3 Initial Criticality is the first fission startup, launching power generation at a new U.S. reactor.
First new US reactor startup since 2016
Fission creates heat; steam spins turbine to generate power
Supports grid reliability and carbon-free baseload
Unit 3 targeted for full service by May-June
Project saw delays and cost overruns amid build challenges
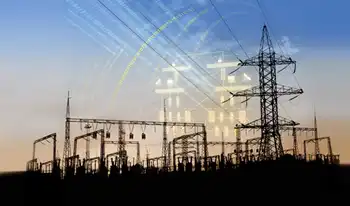
For the first time in almost seven years, a new nuclear reactor has started up in the United States.
On Monday, Georgia Power announced that the Vogtle nuclear reactor Unit 3 has started a nuclear reaction inside the reactor as part of the first new reactors in decades now taking shape at the plant.
Technically, this is called “initial criticality.” It’s when the nuclear fission process starts splitting atoms and generating heat, Georgia Power said in a written announcement.
The heat generated in the nuclear reactor causes water to boil. The resulting steam spins a turbine that’s connected to a generator that creates electricity.
Vogtle’s Unit 3 reactor will be fully in service in May or June, Georgia Power said.
The last time a nuclear reactor reached the same milestone was almost seven years ago in May 2016 when the Tennessee Valley Authority started splitting atoms at the Watts Bar Unit 2 reactor in Tennessee, Scott Burnell, a spokesperson for the Nuclear Regulatory Commission, told CNBC.
“This is a truly exciting time as we prepare to bring online a new nuclear unit that will serve our state with clean and emission-free energy for the next 60 to 80 years,” Chris Womack, CEO of Georgia Power, said in a written statement.
Including the newly turned-on Vogtle Unit 3 reactor, there are currently 93 nuclear reactors operating in the United States and, collectively, they generate 20% of the electricity in the country, although a South Carolina plant leak recently showed how outages can sideline a unit for weeks.
Nuclear reactors, which help combat global warming and support net-zero emissions goals, generate about half of the clean, carbon-free electricity generated in the U.S.
Most of the nuclear power reactors in the United States were constructed between 1970 and 1990, but construction slowed significantly after the accident at Three Mile Island near Middletown, Pennsylvania, on March 28, 1979, even as interest in next-gen nuclear power has grown in recent years. From 1979 through 1988, 67 nuclear reactor construction projects were canceled, according to the U.S. Energy Information Administration.
However, because nuclear energy is generated without releasing carbon dioxide emissions, which cause global warming, the increased sense of urgency in responding to climate change has given nuclear energy a chance at a renaissance as atomic energy heats up again globally.
The cost associated with building nuclear reactors is a major barrier to a potential resurgence in nuclear energy, however, even as nuclear generation costs have fallen to a ten-year low. And the new builds at Vogtle have become an epitome of that charge: The construction of the two Vogtle reactors has been plagued by cost overruns and delays.
Related News
Ontario plunging into energy storage as electricity supply crunch looms
Ontario Energy Storage Procurement accelerates grid flexibility as IESO seeks lithium batteries, pumped storage, compressed…
View more
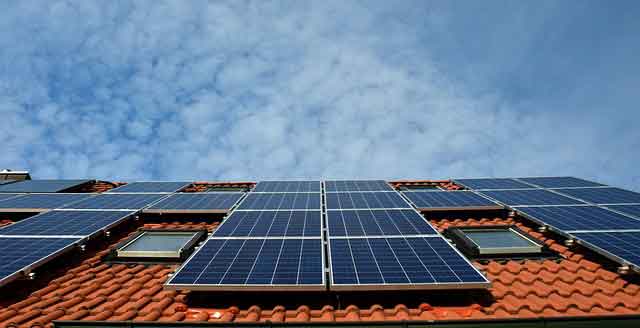
Energy-hungry Europe to brighten profit at US solar equipment makers
European Solar Inverter Demand surges as photovoltaics and residential solar expand during the clean energy…
View more
Smart grid and system improvements help avoid more than 500,000 outages over the summer
ComEd Smart Grid Reliability drives outage reduction across Illinois, leveraging smart switches, grid modernization, and…
View more
Minnesota bill mandating 100% carbon-free electricity by 2040
Minnesota 100% Carbon-Free Electricity advances renewable energy: wind, solar, hydropower, hydrogen, biogas from landfill gas…
View more
California’s Solar Power Cost Shift: A Misguided Policy Threatening Energy Equity
California Rooftop Solar Cost Shift examines PG&E rate hikes, net metering changes, and utility infrastructure…
View more
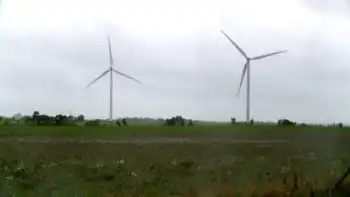
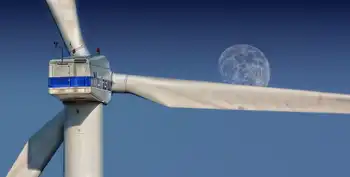
Wind generates more than half of Summerside's electricity in May
Summerside Wind Power reached 61% in May, blending renewable energy, municipal utility operations, and P.E.I.…
View more
Sign Up for Electricity Forum’s Newsletter
Stay informed with our FREE Newsletter — get the latest news, breakthrough technologies, and expert insights, delivered straight to your inbox.
Electricity Today T&D Magazine Subscribe for FREE

Stay informed with the latest T&D policies and technologies.
- Timely insights from industry experts
- Practical solutions T&D engineers
- Free access to every issue
