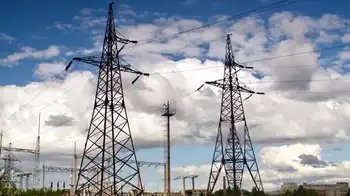
Power line may trigger surge in rates

By Knight Ridder Tribune


High Voltage Maintenance Training Online

Our customized live online or in‑person group training can be delivered to your staff at your location.

  • Live Online
  • 12 hours Instructor-led
  • Group Training Available
Regular Price:
$599
Coupon Price:
$499
Reserve Your Seat Today
A high-tension power line linking eastern Pennsylvania and New Jersey, now in the early stages of development, will probably push up the price of electricity in and around the Lehigh Valley, experts say.

Other new lines, from West Virginia and western Pennsylvania, could pull the price back down - although that outcome is far from certain. "Power costs tend to increase as you move east," Robert McCullough, a Portland, Ore.-based energy consultant, explained. "You would expect that the less expensive power supplies from Pennsylvania will flow to New Jersey."

The Pennsylvania-New Jersey line will start at PPL Corp.'s Susquehanna nuclear power plant, about 75 miles northwest of the Lehigh Valley in Salem Township, Luzerne County, and end at the Roseland substation near Newark, N.J. PPL, of Allentown - the company responsible for the Pennsylvania portion of the 130-mile, 500 kilovolt line - expects the project to be completed by 2012.

Any impact on prices at that time could be an especially sensitive matter because much of eastern Pennsylvania is likely to have recently experienced its biggest-ever electricity rate hike. Rates within PPL's service territory, for example, are expected to surge 35 percent for residents and up to 42 percent for some businesses in 2010.

That's when, in the final step of electricity deregulation, a cap on what PPL can charge is due to expire Caps for other major eastern Pennsylvania electricity providers, including Metropolitan Edison Co. and PECO, are to end the following year. PJM Interconnection of Valley Forge, the electric industry-owned organization that manages the regional power grid, authorized construction of the Pennsylvania-New Jersey line in June.

PJM officials said the decision, made with input from PPL, was based solely on the need to upgrade a multi-state network of wires that could soon be overloaded. Not only is energy consumption on the rise, but so is long-distance electricity transmission. As result of deregulation, utilities that once mostly tapped their own local power plants, now buy more electricity from far-away sources - a transaction that requires transmission over high-tension power lines.

"It's being built for reliability, not economic needs," PJM spokeswoman Paula DuPont-Kidd said, explaining why PJM did not consider the impact the new line could have on the price of electricity.

Such impact, independent electricity experts say, will come from a shift in supply and demand.

Because Pennsylvania has more excess electricity than New Jersey, the price of electricity in Pennsylvania is cheaper than in New Jersey. In fact, at an average price of more than 15 cents per kilowatt hour, New Jersey has the second-most expensive electricity in the continental United States, according to the most recent government data; by comparison, Pennsylvania's average price is about 91/2 cents.

But a new high-tension power line will allow Pennsylvania's excess electricity to cross the state line, into markets it could not previously reach.

As result, New Jersey will be able to compete with Pennsylvania for electricity Pennsylvanians once ha to themselves. "It has to do with relative prices," said Marilyn Showalter, who heads Power in the Public Interest, a group opposed to electricity deregulation.

"Exporting to a higher-priced market will drive up prices (in the lower-priced market)."

Of course, it will also drive down prices in the higher-priced market - that is, New Jersey. PPL also will benefit because it will enjoy better access to a market where its product can fetch a higher price. In the end, Pennsylvania and New Jersey prices will gravitate toward each other, according to Ken Rose, a senior fellow at the Institute of Public Utilities at Michigan State University. He said they will stabilize "somewhere in the middle."

Although PJM did not consider the Pennsylvania-New Jersey line's potential impact on prices before authorizing construction, it has put some effort into studying the matter. PJM projected the line would result in less than a 1 percent price increase in Pennsylvania, but the increase would be more than offset by other new lines carrying to eastern Pennsylvania relatively cheap electricity generated at coal-fired power plants such as in West Virginia.

PJM officials, though, cautioned against placing too much faith in those findings because they were not intended to be the final word on future prices, and the models on which they were based relied heavily on assumptions.

Indeed, Pennsylvania consumer advocate Sonny Popowsky identified one variable that could alter all the equations: global warming legislation. He noted that a carbon tax, which some industry observers expect the federal government to impose in the not-to distant future, would raise the price of coal-based electricity.

If such a tax is imposed, West Virginia would not help offset New Jersey's influence on Pennsylvania electricity prices. "There is that additional wrinkle," Popowsky said. PPL, meanwhile, has sent engineers into the field to sight a path for the 100-mile-long, 200-foot-wide swath the new line will cut through Pennsylvania.

Public Service Electric and Gas Co. of Newark and FirstEnergy Corp. of Akron, Ohio, are responsible or the New Jersey side. It's work that is likely to set off a political firestorm - building the 150-foot steel towers, widely regarded as eyesores, often require condemnation of private property through eminent domain.

Already, Pennsylvania officials are wrangling with the federal government over who will have final say over the matter. But like PJM, PPL describes the project as one of necessity.

"It's not out of the line to say that there could be blackouts if that system isn't shored up," PPL Spokesman Paul Wirth said.

"The bottom line is, if demand for electricity is growing - and it is - new power lines will be needed."

Related News

BloombergNEF: World offshore wind costs 'drop 32% per cent'

Global Renewable LCOE Trends reveal offshore wind costs down 32%, with 10MW turbines, lower CAPEX and OPEX, and parity for solar PV and onshore wind in Europe, China, and California, per BloombergNEF analysis.


Key Points

Benchmarks showing falling LCOE for offshore wind, onshore wind, and solar PV, driven by larger turbines and lower CAPEX

✅ Offshore wind LCOE $78/MWh; $53-64/MWh in DK/NL excl. transmission

✅ Onshore wind $47/MWh; solar PV $51/MWh, best $26-36/MWh

✅ Cost drivers: 10MW turbines, lower CAPEX/OPEX, weak China demand


World offshore wind costs have fallen 32% from just a year ago and 12% compared with the first half of 2019, according to a BNEF long-term outlook from BloombergNEF.

In its latest Levelized Cost of Electricity (LCOE) Update, BloombergNEF said its current global benchmark LCOE estimate for offshore wind is $78 a megawatt-hour.

“New offshore wind projects throughout Europe, including the UK's build-out, now deploy turbines with power ratings up to 10MW, unlocking CAPEX and OPEX savings,” BloombergNEF said.

In Denmark and the Netherlands, it expects the most recent projects financed to achieve $53-64/MWh excluding transmission.

New solar and onshore wind projects have reached parity with average wholesale power prices in California and parts of Europe, while in China levelised costs are below the benchmark average regulated coal price, according to BloombergNEF.

The company's global benchmark levelized cost figures for onshore wind and PV projects financed in the last six months are at $47 and $51 a megawatt-hours, underscoring that renewables are now the cheapest new electricity option in many regions, down 6% and 11% respectively compared with the first half of 2019.

BloombergNEF said for wind this is mainly down to a fall in the price of turbines – 7% lower on average globally compared with the end of 2018.

In China, the world’s largest solar market, the CAPEX of utility-scale PV plants has dropped 11% in the last six months, reaching $0.57m per MW.

“Weak demand for new plants in China has left developers and engineering, procurement and construction firms eager for business, and this has put pressure on CAPEX,” BloombergNEF said.

It added that estimates of the cheapest PV projects financed recently – in India, Chile and Australia – will be able to achieve an LCOE of $27-36/MWh, assuming competitive returns for their equity investors.

Best-in-class onshore wind farms in Brazil, India, Mexico and Texas can reach levelized costs as low as $26-31/MWh already, the research said.

Programs such as the World Bank wind program are helping developing countries accelerate wind deployment as costs continue to drop.

BloombergNEF associate in the energy economics team Tifenn Brandily said: “This is a three- stage process. In phase one, new solar and wind get cheaper than new gas and coal plants on a cost-of- energy basis.

“In phase two, renewables reach parity with power prices. In phase three, they become even cheaper than running existing thermal plants.

“Our analysis shows that phase one has now been reached for two-thirds of the global population.

“Phase two started with California, China and parts of Europe. We expect phase three to be reached on a global scale by 2030.

“As this all plays out, thermal power plants will increasingly be relegated to a balancing role, looking for opportunities to generate when the sun doesn’t shine or the wind doesn’t blow.”


Related News

View more

Canada Finalizes Clean Electricity Regulations for 2050

Canada Clean Electricity Regulations align climate policy with grid reliability, scaling renewables, energy storage, and low-carbon power to reach net-zero by 2050 while maintaining affordability through federal incentives, provincial flexibility, and investment.


Key Points

Nationwide rules to decarbonize power by 2050, capping emissions and protecting grid reliability and affordability.

✅ Net-zero electricity by 2050 with strict emissions limits

✅ Provincial flexibility and federal investments to cut costs

✅ Scales renewables, storage, and clean firm power for reliability


Canada's final Clean Electricity Regulations, unveiled in December 2024, alongside complementary provincial frameworks such as Ontario's clean electricity regulations that guide provincial implementation, represent a critical step toward ensuring a sustainable and reliable energy future. With electricity demand set to rise as the country’s population and economy grow, the Canadian government has put forward a robust plan that balances climate goals with the need for reliable, affordable power.

The regulations are designed to reduce greenhouse gas emissions from the electricity sector, which is already one of Canada's cleanest, with 85% of its electricity sourced from renewable energies like hydro, wind, and solar, and growing attention to clean grids and batteries nationwide. The target is to achieve net-zero emissions in electricity generation by 2050, a goal that will support the country’s broader climate ambitions.

One of the central goals of the Clean Electricity Regulations is to make sure that Canada’s power grid can accommodate future demand in light of a critical electrical supply crunch identified by analysts, while ensuring that emissions are cut effectively. The regulations set strict pollution limits but allow flexibility for provinces and territories to meet these goals in ways that suit their local circumstances. This approach recognizes the diverse energy resources across Canada, from the large-scale hydroelectric capacity in Quebec to the growing wind and solar projects in the West.

A key benefit of these regulations is the assurance that they will not result in higher electricity rates for most Canadians. In fact, according to government analyses, and resources like the online CER bill tool that explain how fees and usage affect charges, the regulations are expected to have a neutral or even slightly positive impact on electricity costs. This is due in part to significant federal investments in the electricity sector, totaling over $60 billion. These investments are intended to support the transition to clean electricity while minimizing costs for consumers.

The shift to clean electricity is also expected to generate significant savings for Canadian households. As energy prices continue to fluctuate, clean electricity, especially from renewable sources, is becoming more cost-competitive compared to fossil fuels. Over the next decade, this transition is expected to result in $15 billion in total savings for Canadians, with 84% of households projected to benefit from lower energy bills. The savings are a result of federal incentives aimed at encouraging the adoption of efficient electric appliances, vehicles, and heating systems.

Moreover, reducing emissions from the electricity sector will play a major role in cutting Canada’s overall greenhouse gas pollution. By 2050, it’s estimated that these regulations will reduce nearly 181 megatonnes of emissions, which is equivalent to removing over 55 million cars from the road. This is a crucial step in meeting Canada’s climate targets and mitigating the impacts of climate change, such as extreme weather events, which have already led to significant economic losses.

The economic benefits extend beyond savings on energy bills. The regulations and the broader clean electricity strategy will create substantial job opportunities. The clean energy sector, which includes jobs in wind, solar, and nuclear power, is poised for massive growth, and provinces like Alberta have outlined a path to clean electricity to support that momentum. It’s estimated that by 2030, the transition to clean electricity could create 400,000 new jobs, with further job growth projected for the years to come. These jobs are expected to include roles in both the construction and operation of new energy infrastructure, many of which will be unionized positions offering good wages and benefits.

To help meet the rising demand for clean energy, the government’s strategy emphasizes technological innovation and the integration of new energy sources, including market design updates such as proposed market changes that can enable investment. Renewable energy technologies such as wind and solar power have become increasingly cost-competitive, and their continued development is expected to reduce the overall cost of electricity generation. The regulations also encourage the adoption of energy storage solutions, which are essential for managing the intermittent nature of renewable energy sources.

In addition to the environmental and economic benefits, the Clean Electricity Regulations will help improve public health. Air pollution from fossil fuel power generation is a major contributor to respiratory illnesses and other health issues. By transitioning to clean energy sources, Canada can reduce harmful air pollutants, leading to better health outcomes and a lower burden on the healthcare system.

As Canada moves toward a net-zero electricity grid, including the federal 2035 target that some have criticized as changing goalposts in Saskatchewan, the Clean Electricity Regulations represent a comprehensive and flexible approach to managing the energy transition. With significant investments in clean energy technologies and the adoption of policies that ensure affordable electricity for all Canadians, the government is setting the stage for a cleaner, more sustainable future. These efforts will not only help Canada meet its climate goals but also create a thriving clean energy economy that benefits workers, businesses, and families across the country.


Related News

View more

How Energy Use Has Evolved Throughout U.S. History

U.S. Energy Transition traces the shift from coal and oil to natural gas, nuclear power, and renewables like wind and solar, driven by efficiency, grid modernization, climate goals, and economic innovation.


Key Points

The U.S. Energy Transition is the shift from fossil fuels to cleaner power, driven by tech, policy, and markets.

✅ Shift from coal and oil to gas, nuclear, wind, and solar

✅ Enabled by grid modernization, storage, and efficiency

✅ Aims to cut emissions while ensuring reliability and affordability


The evolution of energy use in the United States is a dynamic narrative that reflects technological advancements, economic shifts, environmental awareness, and societal changes over time. From the nation's early reliance on wood and coal to the modern era dominated by oil, natural gas, and renewable sources, the story of energy consumption in the U.S. is a testament to innovation and adaptation.

Early Energy Sources: Wood and Coal

In the early days of U.S. history, energy needs were primarily met through renewable resources such as wood for heating and cooking. As industrialization took hold in the 19th century, coal emerged as a dominant energy source, fueling steam engines and powering factories, railways, and urban growth. The widespread availability of coal spurred economic development and shaped the nation's infrastructure.

The Rise of Petroleum and Natural Gas

The discovery and commercialization of petroleum in the late 19th century transformed the energy landscape once again. Oil quickly became a cornerstone of the U.S. economy, powering transportation, industry, and residential heating, and informing debates about U.S. energy security in policy circles. Concurrently, natural gas emerged as a significant energy source, particularly for heating and electricity generation, as pipelines expanded across the country.

Electricity Revolution

The 20th century witnessed a revolution in electricity generation and consumption, and understanding where electricity comes from helps contextualize how systems evolved. The development of hydroelectric power, spurred by projects like the Hoover Dam and Tennessee Valley Authority, provided clean and renewable energy to millions of Americans. The widespread electrification of rural areas and the proliferation of appliances in homes and businesses transformed daily life and spurred economic growth.

Nuclear Power and Energy Diversification

In the mid-20th century, nuclear power emerged as a promising alternative to fossil fuels, promising abundant energy with minimal greenhouse gas emissions. Despite concerns about safety and waste disposal, nuclear power plants became a significant part of the U.S. energy mix, providing a stable base load of electricity, even as the aging U.S. power grid complicates integration of variable renewables.

Renewable Energy Revolution

In recent decades, the U.S. has seen a growing emphasis on renewable energy sources such as wind, solar, and geothermal power, yet market shocks and high fuel prices alone have not guaranteed a rapid green revolution, prompting broader policy and investment responses. Advances in technology, declining costs, and environmental concerns have driven investments in clean energy infrastructure and policies promoting renewable energy adoption. States like California and Texas lead the nation in wind and solar energy production, demonstrating the feasibility and benefits of transitioning to sustainable energy sources.

Energy Efficiency and Conservation

Alongside shifts in energy sources, improvements in energy efficiency and conservation have played a crucial role in reducing per capita energy consumption and greenhouse gas emissions. Energy-efficient appliances, building codes, and transportation innovations have helped mitigate the environmental impact of energy use while reducing costs for consumers and businesses, and weather and economic factors also influence demand; for example, U.S. power demand fell in 2023 on milder weather, underscoring the interplay between efficiency and usage.

Challenges and Opportunities

Looking ahead, the U.S. faces both challenges and opportunities in its energy future, as recent energy crisis effects ripple across electricity, gas, and EVs alike. Addressing climate change requires further investments in renewable energy, grid modernization, and energy storage technologies. Balancing energy security, affordability, and environmental sustainability remains a complex task that requires collaboration between government, industry, and society.

Conclusion

The evolution of energy use throughout U.S. history reflects a continuous quest for innovation, economic growth, and environmental stewardship. From wood and coal to nuclear power and renewables, each era has brought new challenges and opportunities in meeting the nation's energy needs. As the U.S. transitions towards a cleaner and more sustainable energy future, leveraging technological advancements and embracing policy solutions, amid debates over U.S. energy dominance, will be essential in shaping the next chapter of America's energy story.


Related News

View more

CALIFORNIA: Why your electricity prices are soaring

California Electricity Prices are surging across PG&E, SCE, and SDG&E territories, driven by fixed grid costs, wildfire mitigation, CARE subsidies, and Net Energy Metering, burdening low-income renters and increasing statewide utility debt, CPUC reports show.


Key Points

High rates driven by fixed grid costs and policies, burdening low-income customers across PG&E, SCE, and SDG&E.

✅ Fixed costs: transmission, distribution, wildfire mitigation

✅ Solar NEM shifts grid costs onto remaining ratepayers

✅ CPUC, CARE, LIHEAP aim to relieve rising utility debt


California's electricity prices are among the highest in the country, new research says, and those costs are falling disproportionately on a customer base that's already struggling to pay their bills.

PG&E customers pay about 80 percent more per kilowatt-hour than the national average, according to a study by the energy institute at UC Berkeley's Haas Business School with the nonprofit think tank Next 10. The study analyzed the rates of the state's three largest investor-owned utilities and found that Southern California Edison charged 45 percent more than the national average, while San Diego Gas & Electric charged double. Even low-income residents enrolled in the California Alternate Rates for Energy program paid more than the average American.

"California's retail prices are out of line with utilities across the country," said UC Berkeley assistant professor and study co-author Meredith Fowlie, citing Hawaii and some New England states among the outliers with even higher rates. "And they're increasing, as regulators face calls for action across the state."


So why are prices so high?
One reason is that California's size and geography inflate the "fixed" costs of operating its electric system, even as the state considers revamping electricity rates to clean the grid in parallel, which include maintenance, generation, transmission, and distribution as well as public programs like CARE and wildfire mitigation, according to the study. Those costs don't change based on how much electricity residents consume, yet between 66 and 77 percent of Californians' electricity bills are used to offset the costs of those programs, the study found.

These are legitimate expenses, Fowlie said. However, because lower-income residents use only moderately less electricity than higher income households, they end up with a disproportionate share of the burden, according to the study. And while the bills of older, wealthier Californians continue to decrease as they adopt cost-efficient alternatives like the state's Net Energy Metering solar program and the resulting solar power cost shift dynamic, costs will keep rising for a shrinking customer base composed mostly of low- and middle-income renters who still use electricity as their main energy source.

"When households adopt solar, they're not paying their fair share," Fowlie said. While solar users generate power that decreases their bills, they still rely on the state's electric grid for much of their power consumption - without paying for its fixed costs like others do.

"As this continues it's going to make electricity even more unaffordable," said F. Noel Perry, founder of Next 10, which funds nonpartisan research on the economy and environment.

PG&E this month raised its electricity rates 3.7 percent, amounting to a $5.01 a month increase for the average residential customer, who now pays $138.85 a month for electricity. It was the second increase this year, as regulators consider major changes to electric bills statewide, said Mark Toney, executive director of The Utility Reform Network, who noted that higher rates are particularly difficult for those who have lost their jobs in the pandemic. The California Public Utilities Commission last year approved a PG&E plan for more incremental increases through Dec. 31, 2022.

PG&E spokesperson Kristi Jourdan said in an email statement that the company was committed to keeping prices as low as possible as the state weighs income-based flat-fee utility bills proposals, and that although some programs are meant to be subsidized through rates, "in other cases, given that some customers have greater access to energy alternatives, the remaining customers - often those with limited means - are left paying unintended subsidies."

The costs quickly became overwhelming for Fretea Sylver, who rents a small house in Castro Valley and lost much of her work as the owner of a small woodwork business early in the pandemic. "They're little tiny changes but they accumulate. You turn around and you're like wait a second, why is my bill $20 more?," Sylver said. "And you have to pay it, no matter what."

Many more are unable to pay. Between February and December of last year, Californians accumulated more than $650 million in late payments from their utility providers, according to an analysis by the CPUC. In 2019, utility debt fell $71,646,869 from the prior year.

Sylver, who was on unemployment for 10 months last year, accumulated over $600 in unpaid PG&E bills. "We sort of went into a bit of debt, having to use credit cards and loans to sustain what we had to pay for. We're trying to catch up," Sylver said. The family received some help from the federal Low-Income Home Energy Assistance Program, which provides up to $1,000 to those who are late on their utility bills.

The study identified improvements to make California's power grid more equitable, such as income-based fixed electricity charges for the grid's cost that are based on income. Republican state senators this week called on the state to use federal relief money to forgive the billions Californians owe in utility debt, even as some lawmakers move to overturn income-based utility charges amid ongoing debate. Californians are currently protected by a statewide moratorium on disconnection for nonpayment of electricity bills through June 30. The CPUC this month began taking public input on the issue of how to grant some relief to those who have fallen behind on their utility bills.

This article is part of the California Divide, a collaboration among newsrooms examining income inequality and economic survival in California.


Related News

View more

Cheap oil contagion is clear and present danger to Canada

Canada Oil Recession Outlook analyzes the Russia-Saudi price war, OPEC discord, COVID-19 demand shock, WTI and WCS collapse, Alberta oilsands exposure, U.S. shale stress, and GDP risks from blockades and fiscal responses.


Key Points

An outlook on how the oil price war and COVID-19 demand shock could tip Canada into recession and strain producers.

✅ WTI and WCS prices plunge on OPEC-Russia discord

✅ Alberta oilsands face break-even pressure near 30 USD WTI

✅ RBC flags global recession; GDP hit from blockades, virus


A war between Russia and Saudi Arabia for market share for oil may have been triggered by the COVID-19 pandemic in China, but the oil price crash contagion that it will spread could have impacts that last longer than the virus.

The prospects for Canada are not good.

Plunging oil prices, reduced economic activity from virus containment, and the fallout from weeks of railway blockades over the Coastal GasLink pipeline all add up to “a one-two-three punch that I think is almost inevitably going to put Canada in a position where its growth has to be negative,” said Dan McTeague, a former Liberal MP and current president of Canadians for Affordable Energy. The situation “certainly has the makings” of a recession, said Ken Peacock, chief economist for the Business Council of British Columbia.

“At a minimum, it’s going to be very disruptive and we’re going to have maybe one negative quarter,” Peacock said. “Whether there’s a second one, where it gets labeled a recession, is a different question. But it’s going to generate some turmoil and challenges over the next two quarters – there’s no doubt about that.”

RBC Economics on March 13 announced it now predicts a global recession and cut its growth projections for Canada's economy in 2020 by half a per cent.

Oil price futures plunged 30% last week, dragging stock markets and currencies, including the Canadian dollar, down with them, even as a deep freeze strained U.S. energy systems. That drop came on top of a 17% decline in February, due to falling demand for oil due to the virus.

The latest price plunge – the worst since the 1991 Gulf War – was the result of Russia and the Organization of Petroleum Exporting Countries (OPEC), led by Saudi Arabia, failing to agree on oil production cuts.

The COVID-19 outbreak in China – the world’s second-largest oil consumer – had resulted in a dramatic drop in oil demand in that country, and a sudden glut of oil, with the U.S. energy crisis affecting electricity, gas and EV markets.

OPEC has historically been able to moderate global oil prices by controlling output. But when Russia refused to co-operate with OPEC and agree to production cuts, Saudi Arabia’s state-owned company, Aramco, announced it plans to boost its oil output from 9.7 million barrels per day (bpd) to 12.3 million bpd in April.

In response to that announcement, West Texas Intermediate (WTI) prices dropped 18% to below US$34 per barrel while the Canadian Crude Index fell 24% to US$21. Western Canadian Select dropped 39% to US$15.73.

The effect on Alberta oilsands producers was severe and immediate. Cenovus Energy Inc. (TSX:CVE) saw roughly $2 billion in market cap erased on March 9, when its stock dropped by 52%, which came on top of a 12% drop March 6.

The company responded the very next day by announcing it would cut spending by 32% in 2020, suspend its oil-by-rail program and defer expansion projects.

MEG Energy Corp. (TSX:MEG), which suffered a 56% share price drop on March 9, also announced a 20% reduction in its 2020 capital spending plan.

Peter Tertzakian, chief economist for ARC Energy Research Institute, wrote last week that Russia’s plan is to try to hurt U.S. shale oil producers, who have more than doubled U.S. oil production over the past decade.

Anas Alhajji, a global oil analyst, expects that plan could work. Even before the oil price shock, he had predicted the great shale boom in the U.S. was coming to an end.

“Shale production will decline, and the myth of ‘explosive growth’ will end,” he told Business in Vancouver. “The impact is global and Canadian producers might suffer even more if the oil that Saudi Arabia sends to the U.S. is medium and heavy. This might last longer than what people think.”

The question for Alberta is how Canadian producers can continue to operate through a period of cheap oil. Alberta producers do not compete on the global market. They serve a niche market of U.S. heavy oil refiners, and Biden-era policy is seen as potentially more favourable for Canada’s energy sector than alternatives.

“On the positive side, the industry is battle-hardened,” Tertzakian wrote. “Over the past five years, innovative companies have already learned to endure some of the lowest prices in the world.”

But he added that they need WTI prices of US$30 per barrel just to break even.

“But that’s an average break-even threshold for an industry with a wide variation in costs. That means at that level about half the companies can’t pay their bills and half are treading water.”

Just prior to the oil price plunge, the International Energy Agency (IEA) updated its 2020 forecast for global oil consumption from an 825,000 bpd increase in oil consumption to a 90,000 bpd decrease, due to the COVID-19 virus and consequent economic contraction and reduction in travel.

The IEA predicts global oil demand won’t return to “normal” until the second half of 2020. But even if demand does return to pre-virus levels, that doesn’t mean oil prices will – not if Saudi Arabia can sustain increased oil production at low prices, and evolving clean grid priorities could influence the trajectory too.

The oil plunge was greeted in Alberta with alarm. Alberta Premier Jason Kenney warned Alberta is in “uncharted territory” as consumers are urged to lock in rates and said his government might have to review its balanced budget and resort to emergency deficit spending.

While British Columbians – who pay some of the highest gasoline prices in North America – will enjoy lower gasoline prices at a time when prices are usually starting a seasonal spike, B.C.’s economy could feel knock-on effects from a recession in Alberta.

“We sell a lot of inputs, do a lot of trade with Alberta, so it’s important for B.C., Alberta’s economic health,” Peacock said, “and recent tensions over electricity purchase talks underscore that.”

Last week, the Trudeau government announced $1 billion in emergency funding to cope with the virus and waived a one-week waiting period for unemployment insurance.


Related News

View more

Solar changing shape of electricity prices in Northern Europe

EU Solar Impact on Electricity Prices highlights how rising solar PV penetration drives negative pricing, shifts peak hours, pressures wholesale markets, and challenges grid balancing, interconnection, and flexibility amid changing demand and renewables growth.


Key Points

Explains how rising solar PV cuts wholesale prices, shifts negative-price hours, and strains grid flexibility.

✅ Negative pricing events surge with higher solar penetration.

✅ Afternoon price dips replace night-time wind-led lows.

✅ Grid balancing, interconnectors, and flexibility become critical.


The latest EU electricity market report has confirmed the affect deeper penetration of solar is having on wholesale electricity prices more broadly.

The Quarterly Report on European Electricity Markets for the final three months of last year noted the number of periods of negative electricity pricing doubled from 2019, to almost 1,600 such events, as global renewables set new records in deployment across markets.

Having experienced just three negative price events in 2019, the Netherlands recorded almost 100 last year “amid a dramatic increase in solar PV capacity,” in the nation, according to the report.

Whilst stressing the exceptional nature of the Covid-19 pandemic on power consumption patterns, the quarterly update also noted a shift in the hours during which negative electric pricing occurred in renewables poster child Germany. Previously such events were most common at night, during periods of high wind speed and low demand, but 2020 saw a switch to afternoon negative pricing. “Thus,” stated the report, “solar PV became the main driver behind prices falling into negative territory in the German market in 2020, as Germany's solar boost accelerated, and also put afternoon prices under pressure generally.”

The report also highlighted two instances of scarce electricity–in mid September and on December 9–as evidence of the problems associated with accommodating a rising proportion of intermittent clean energy capacity into the grid, and called for more joined-up cross-border power networks, amid pushback from Russian oil and gas across the continent.

Rising solar generation–along with higher gas output, year on year–also helped the Netherlands generate a net surplus of electricity last year, after being a net importer “for many years.” The EU report also noted a beneficial effect of rising solar generation capacity on Hungary‘s national electricity account, and cited a solar “boom” in that country and Poland, mirroring rapid solar PV growth in China in recent years.

With Covid-19 falls in demand helping renewables generate more of Europe's electricity (39%) than fossil fuels (36%) for the first time, as renewables surpassed fossil fuels across Europe, the market report observed the 5% of the bloc's power produced from solar closed in on the 6% accounted for by hard coal. In the final three months of the year, European solar output rose 12%, year on year, to 18 TWh and “the increase was almost single-handedly driven by Spain,” the study added.

With coal and lignite-fired power plunging 22% last year across the bloc, it is estimated the European power sector reduced its carbon footprint 14% as part of Europe's green surge although the quarterly report warned cold weather, lower wind speeds and rising gas prices in the opening months of this year are likely to see carbon emissions rebound.

There was good news on the transport front, though, with the report stating the scale of the European “electrically-charged vehicle” fleet doubled in 2020, to 2 million, with almost half a million of the new registrations arriving in the final months of the year. That meant cars with plug sockets accounted for a remarkable 17% of new purchases in Q4, twice the proportion seen in China and a slice of the pie six times bigger than such products claimed in the U.S.


Related News

View more

Sign Up for Electricity Forum’s Newsletter

Stay informed with our FREE Newsletter — get the latest news, breakthrough technologies, and expert insights, delivered straight to your inbox.

Electricity Today T&D Magazine Subscribe for FREE

Stay informed with the latest T&D policies and technologies.
  • Timely insights from industry experts
  • Practical solutions T&D engineers
  • Free access to every issue

Live Online & In-person Group Training

Advantages To Instructor-Led Training – Instructor-Led Course, Customized Training, Multiple Locations, Economical, CEU Credits, Course Discounts.

Request For Quotation

Whether you would prefer Live Online or In-Person instruction, our electrical training courses can be tailored to meet your company's specific requirements and delivered to your employees in one location or at various locations.