Wind and solar make more electricity than nuclear for first time in UK


Uk renewables

NFPA 70b Training - Electrical Maintenance

Our customized live online or in‑person group training can be delivered to your staff at your location.

  • Live Online
  • 12 hours Instructor-led
  • Group Training Available
Regular Price:
$599
Coupon Price:
$499
Reserve Your Seat Today

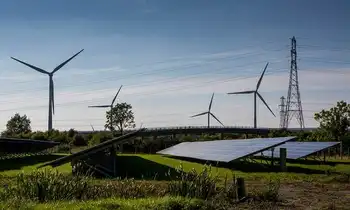
UK Renewables Surpass Nuclear Milestone as wind farms and solar panels outpace atomic output, cutting greenhouse gas emissions. BEIS data show low-carbon power generation rising while onshore wind subsidies and auction timelines face policy debate.


Key Points

It is the quarter when UK wind and solar generated more electricity than nuclear, signaling cleaner, low-carbon growth.

✅ BEIS reports wind and solar at 18.33 TWh vs nuclear 16.69 TWh

✅ Energy sector emissions fell 8% as coal use dropped

✅ Calls grow to reopen onshore wind support via CFD auctions


Wind farms and solar panels, with wind leading the power mix during key periods, produced more electricity than the UK’s eight nuclear power stations for the first time at the end of last year, official figures show.

Britain’s greenhouse gas emissions also continued to fall, dropping 3% in 2017, as coal use fell and the use of renewables climbed, though low-carbon generation stalled in 2019 according to later data.

Energy experienced the biggest drop in emissions of any UK sector, of 8%, while pollution from transport and businesses stayed flat.

Energy industry chiefs said the figures showed that the government should rethink its ban on onshore wind subsidies, a move that ministers have hinted could happen soon.

Lawrence Slade, chief executive of the big six lobby group Energy UK, said: “We need to keep up the pace ... by ensuring that the lowest cost renewables are no longer excluded from the market.”

Across the whole year, low-carbon sources of power – wind, solar, biomass and nuclear – provided a record 50.4% of electricity, up from 45.7% in 2016, when wind beat coal for the first time.

But in the fourth quarter of 2017, high wind speeds, new renewables installations and lower nuclear output saw wind and solar becoming the second biggest source of power for the first time.

Wind and solar generated 18.33 terawatt hours (TWh), with nuclear on 16.69TWh, and the UK later set a new record for wind power during 2019, the figures published by the Department for Business, Energy and Industrial Strategy show.

But renewables still have a long way to go to catch up with gas, the UK’s top source of electricity at 36.12TWh, which saw its share of generation fall slightly, though at times wind became the main source as capacity expanded.

Greenpeace said the figures showed the government should capitalise on its lead in renewables and “stop wasting time and money propping up nuclear power”.

Horizon Nuclear Power, a subsidiary of the Japanese conglomerate Hitachi, is in talks with Whitehall officials for a financial support package from the government, which it says it needs by midsummer.

By contrast, large-scale solar and onshore wind projects are not eligible for support, after the Conservative government cut subsidies in 2015.

However the energy minister, Claire Perry, recently told House Magazine that “we will have another auction that brings forward wind and solar, we just haven’t yet said when”.


Related News

Related News

U.S. Residents Averaged Fewer Power Outages in 2022

2022 U.S. Power Outage Statistics show lower SAIDI as fewer major events hit, with SAIFI trends, electric reliability, outage duration and frequency shaped by hurricanes, winter storms, vegetation, and utility practices across states.


Key Points

They report SAIDI and SAIFI for 2022, showing outage duration, frequency, and impacts of major weather events.

✅ 2022 SAIDI averaged 5.6 hours; SAIFI averaged 1.4 interruptions.

✅ Fewer major events lowered outage duration versus 2021.

✅ Hurricanes and winter storms drove long outages in several states.


In 2022, U.S. electricity consumers on average experienced about 5.5 hours of power disruptions, a decrease from nearly two hours compared to 2021. This information comes from the latest Annual Electric Power Industry Report. The reduction in yearly power interruptions primarily resulted from fewer significant events in 2022 compared to the previous year, and utility disaster planning continues to support grid resilience as severe weather persists.

Since 2013, excluding major events, the annual average duration of power interruptions has consistently hovered around two hours. Factors contributing to major power disruptions include weather-related incidents, vegetation interference near power lines, and specific utility practices, while pandemic-related grid operations influenced workforce planning more than outage frequency. To assess the reliability of U.S. electric utilities, two key indexes are utilized:

  • The System Average Interruption Duration Index (SAIDI) calculates the total length (in hours) an average customer endures non-brief power interruptions over a year.
  • The System Average Interruption Frequency Index (SAIFI) tracks the number of times interruptions occur.

The influence of major events on electrical reliability is gauged by comparing affected states' SAIDI and SAIFI values against the U.S. average, which was 5.6 hours of outages and 1.4 outages per customer in 2022. The year witnessed 18 weather-related disasters in the U.S., each resulting in over $1 billion in damages, and COVID-19 grid assessments indicated the electricity system was largely safe from pandemic impacts. Noteworthy major events include:

  • Hurricane Ian in September 2022, leaving over 2.6 million Floridian customers without electricity, with restoration in some areas taking weeks rather than days.
  • Hurricane Nicole in November 2022, causing over 300,000 Florida customers to lose power.
  • Winter Storm Elliott in December 2022, affecting over 1.5 million customers in multiple states including Texas where utilities struggled after Hurricane Harvey to restore service, and Florida, and bringing up to four feet of snow in parts of New York.

In 2022, states like Florida, West Virginia, Maine, Vermont, and New Hampshire experienced the most prolonged power interruptions, with New Hampshire averaging 10.3 hours and Florida 19.1 hours, and FPL's Irma storm response illustrates how restoration can take days or weeks in severe cases. Conversely, the District of Columbia, Delaware, Rhode Island, Nebraska, and Iowa had the shortest total interruptions, with the District of Columbia averaging just 34 minutes and Iowa 85 minutes.

The frequency of outages, unlike their duration, is more often linked to non-major events. Across the nation, Alaska recorded the highest number of power disruptions per customer (averaging 3.5), followed by several heavily forested states like Tennessee and Maine. Power outages due to falling tree branches are common, particularly during winter storms that burden tree limbs and power lines, as seen in a North Seattle outage affecting 13,000 customers. The District of Columbia stood out with the shortest and fewest outages per customer.


Related News

View more

UK low-carbon electricity generation stalls in 2019

UK low-carbon electricity 2019 saw stalled growth as renewables rose slightly, wind expanded, nuclear output fell, coal hit record lows, and net-zero targets demand faster deployment to cut CO2 intensity below 100gCO2/kWh.


Key Points

Low-carbon sources supplied 54% of UK power in 2019, up just 1TWh; wind grew, nuclear fell, and coal dropped to 2%.

✅ Wind up 8TWh; nuclear down 9TWh amid outages

✅ Fossil fuels 43% of generation; coal at 2%

✅ Net-zero needs 15TWh per year added to 2030


The amount of electricity generated by low-carbon sources in the UK stalled in 2019, Carbon Brief analysis shows.

Low-carbon electricity output from wind, solar, nuclear, hydro and biomass rose by just 1 terawatt hour (TWh, less than 1%) in 2019. It represents the smallest annual increase in a decade, where annual growth averaged 9TWh. This growth will need to double in the 2020s to meet UK climate targets while replacing old nuclear plants as they retire.

Some 54% of UK electricity generation in 2019 came from low-carbon sources, including 37% from renewables and 20% from wind alone, underscoring wind's leading role in the power mix during key periods. A record-low 43% was from fossil fuels, with 41% from gas and just 2% from coal, also a record low. In 2010, fossil fuels generated 75% of the total.

Carbon Brief’s analysis of UK electricity generation in 2019 is based on figures from BM Reports and the Department for Business, Energy and Industrial Strategy (BEIS). See the methodology at the end for more on how the analysis was conducted.

The numbers differ from those published earlier in January by National Grid, which were for electricity supplied in Great Britain only (England, Wales and Scotland, but excluding Northern Ireland), including via imports from other countries.

Low-carbon low
In 2019, the UK became the first major economy to target net-zero greenhouse gas emissions by 2050, increasing the ambition of its legally binding Climate Change Act.

To date, the country has cut its emissions by around two-fifths since 1990, with almost all of its recent progress coming from the electricity sector.

Emissions from electricity generation have fallen rapidly in the decade since 2010 as coal power has been almost phased out and even gas output has declined. Fossil fuels have been displaced by falling demand and by renewables, such as wind, solar and biomass.

But Carbon Brief’s annual analysis of UK electricity generation shows progress stalled in 2019, with the output from low-carbon sources barely increasing compared to a year earlier.

The chart below shows low-carbon generation in each year since 2010 (grey bars) and the estimated level in 2019 (red). The pale grey bars show the estimated future output of existing low-carbon sources after old nuclear plants retire and the pale red bars show the amount of new generation needed to keep electricity sector emissions to less than 100 grammes of CO2 per kilowatt hour (gCO2/kWh), the UK’s nominal target for the sector.

 Annual electricity generation in the UK by fuel, terawatt hours, 2010-2019. Top panel: fuel by fuel. Bottom panel: cumulative total generation from all sources. Source: BEIS energy trends, BM Reports and Carbon Brief analysis. Chart by Carbon Brief using Highcharts.
As the chart shows, the UK will require significantly more low-carbon electricity over the next decade as part of meeting its legally binding climate goals.

The nominal 100gCO2/kWh target for 2030 was set in the context of the UK’s less ambitious goal of cutting emissions to 80% below 1990 levels by 2050. Now that the country is aiming to cut emissions to net-zero by 2050, that 100gCO2/kWh indicator is likely to be the bare minimum.

Even so, it would require a rapid step up in the pace of low-carbon expansion, compared to the increases seen over the past decade. On average, low-carbon generation has risen by 9TWh each year in the decade since 2010 – including a rise of just 1TWh in 2019.

Given scheduled nuclear retirements and rising demand expected by the Committee on Climate Change (CCC) – with some electrification of transport and heating – low-carbon generation would need to increase by 15TWh each year until 2030, just to meet the benchmark of 100gCO2/kWh.

For context, the 3.2 gigawatt (GW) Hinkley C new nuclear plant being built in Somerset will generate around 25TWh once completed around 2026. The world’s largest offshore windfarm, the 1.2GW Hornsea One scheme off the Yorkshire coast, will generate around 5TWh each year.

The new Conservative government is targeting 40GW of offshore wind by 2030, up from today’s figure of around 8GW. If policies are put in place to meet this goal, then it could keep power sector emissions below 100gCO2/kWh, depending on the actual performance of the windfarms built.

However, new onshore wind and solar, further new nuclear or other low-carbon generation, such as gas with carbon capture and storage (CCS), is likely to be needed if demand is higher than expected, or if the 100gCO2/kWh benchmark is too weak in the context of net-zero by 2050.

The CCC says it is “likely” to “reflect the need for more rapid deployment” of low-carbon towards net-zero emissions in its advice on the sixth UK carbon budget for 2033-2037, due in September.

Trading places
Looking more closely at UK electricity generation in 2019, Carbon Brief’s analysis shows why there was so little growth for low-carbon sources compared to the previous year.

There was another increase for wind power in 2019 (up 8TWh, 14%), with record wind generation as several large new windfarms were completed including the 1.2GW Hornsea One project in October and the 0.6GW Beatrice offshore windfarm in Q2 of 2019. But this was offset by a decline for nuclear (down 9TWh, 14%), due to ongoing outages for reactors at Hunterston in Scotland and Dungeness in Kent.

(Analysis of data held by trade organisation RenewableUK suggests some 0.6GW of onshore wind capacity also started operating in 2019, including the 0.2GW Dorenell scheme in Moray, Scotland.)

As a result of these movements, the UK’s windfarms overtook nuclear for the first time ever in 2019, becoming the country’s second-largest source of electricity generation, and earlier, wind and solar together surpassed nuclear in the UK as momentum built. This is shown in the figure below, with wind (green line, top panel) trading places with nuclear (purple) and gas (dark blue) down around 25% since 2010 but remaining the single-largest source.

 Annual electricity generation in the UK by fuel, terawatt hours, 2010-2019. Top panel: fuel by fuel. Bottom panel: cumulative total generation from all sources. Source: BEIS energy trends, BM Reports and Carbon Brief analysis. Chart by Carbon Brief using Highcharts.
The UK’s currently suspended nuclear plants are due to return to service in January and March, according to operator EDF, the French state-backed utility firm. However, as noted above, most of the UK’s nuclear fleet is set to retire during the 2020s, with only Sizewell B in Suffolk due to still be operating by 2030. Hunterston is scheduled to retire by 2023 and Dungeness by 2028.

Set against these losses, the UK has a pipeline of offshore windfarms, secured via “contracts for difference” with the government, at a series of auctions. The most recent auction, in September 2019, saw prices below £40 per megawatt hour – similar to current wholesale electricity prices.

However, the capacity contracted so far is not sufficient to meet the government’s target of 40GW by 2030, meaning further auctions – or some other policy mechanism – will be required.

Coal zero
As well as the switch between wind and nuclear, 2019 also saw coal fall below solar for the first time across a full year, echoing the 2016 moment when wind outgenerated coal across the UK, after it suffered another 60% reduction in electricity output. Just six coal plants remain in the UK, with Aberthaw B in Wales and Fiddlers Ferry in Cheshire closing in March.

Coal accounted for just 2% of UK generation in 2019, a record-low coal share since centralised electricity supplies started to operate in 1882. The fuel met 40% of UK needs as recently as 2012, but has plummeted thanks to falling demand, rising renewables, cheaper gas and higher CO2 prices.

The reduction in average coal generation hides the fact that the fuel is now often not required at all to meet the UK’s electricity needs. The chart below shows the number of days each year when coal output was zero in 2019 (red line) and the two previous years (blue).

 Cumulative number of days when UK electricity generation from renewable sources has been higher than that from fossil fuels. Source: BEIS energy trends, BM Reports and Carbon Brief analysis. Chart by Carbon Brief using Highcharts.
The 83 days in 2019 with zero coal generation amount to nearly a quarter of the year and include the record-breaking 18-day stretch without the fuel.

Great Britain has been running for a record TWO WEEKS without using coal to generate electricity – the first time this has happened since 1882.

The country’s grid has been coal-free for 45% of hours in 2019 so far.https://www.carbonbrief.org/countdown-to-2025-tracking-the-uk-coal-phase-out …

Coal generation was set for significant reductions around the world in 2019 – including a 20% reduction for the EU as a whole – according to analysis published by Carbon Brief in November.

Notably, overall UK electricity generation fell by another 9TWh in 2019 (3%), bringing the total decline to 58TWh since 2010. This is equivalent to more than twice the output from the Hinkley C scheme being built in Somerset. As Carbon Brief explained last year, falling demand has had a similar impact on electricity-sector CO2 emissions as the increase in output from renewables.

This is illustrated by the fact that the 9TWh reduction in overall generation translated into a 9TWh (6%) cut in fossil-fuel generation during 2019, with coal falling by 10TWh and gas rising marginally.

Increasingly renewable
As fossil-fuel output and overall generation have declined, the UK’s renewable sources of electricity have continued to increase. Their output has risen nearly five-fold in the past decade and their share of the UK total has increased from 7% in 2010 to 37% in 2019.

As a result, the UK’s increasingly renewable grid is seeing more minutes, hours and days during which the likes of wind, solar and biomass collectively outpace all fossil fuels put together, and on some days wind is the main source as well.

The chart below shows the number of days during each year when renewables generated more electricity than fossil fuels in 2019 (red line) and each of the previous four years (blue lines). In total, nearly two-fifths of days in 2019 crossed this threshold.

 Cumulative number of days when the UK has not generated any electricity from coal. Source: BEIS energy trends, BM Reports and Carbon Brief analysis. Chart by Carbon Brief using Highcharts.
There were also four months in 2019 when renewables generated more of the UK’s electricity than fossil fuels: March, August, September and December. The first ever such month came in September 2018 and more are certain to follow.

National Grid, which manages Great Britain’s high-voltage electricity transmission network, is aiming to be able to run the system without fossil fuels by 2025, at least for short periods. At present, it sometimes has to ask windfarm operators to switch off and gas plants to start running in order to keep the electricity grid stable.

Note that biomass accounted for 11% of UK electricity generation in 2019, nearly a third of the total from all renewables. Some two-thirds of the biomass output is from “plant biomass”, primarily wood pellets burnt at Lynemouth in Northumberland and the Drax plant in Yorkshire. The remainder was from an array of smaller sites based on landfill gas, sewage gas or anaerobic digestion.

The CCC says the UK should “move away” from large-scale biomass power plants, once existing subsidy contracts for Drax and Lynemouth expire in 2027.

Using biomass to generate electricity is not zero-carbon and in some circumstances could lead to higher emissions than from fossil fuels. Moreover, there are more valuable uses for the world’s limited supply of biomass feedstock, the CCC says, including carbon sequestration and hard-to-abate sectors with few alternatives.

Methodology
The figures in the article are from Carbon Brief analysis of data from BEIS Energy Trends chapter 5 and chapter 6, as well as from BM Reports. The figures from BM Reports are for electricity supplied to the grid in Great Britain only and are adjusted to include Northern Ireland.

In Carbon Brief’s analysis, the BM Reports numbers are also adjusted to account for electricity used by power plants on site and for generation by plants not connected to the high-voltage national grid. This includes many onshore windfarms, as well as industrial gas combined heat and power plants and those burning landfill gas, waste or sewage gas.

By design, the Carbon Brief analysis is intended to align as closely as possible to the official government figures on electricity generated in the UK, reported in BEIS Energy Trends table 5.1.

Briefly, the raw data for each fuel is in most cases adjusted with a multiplier, derived from the ratio between the reported BEIS numbers and unadjusted figures for previous quarters.

Carbon Brief’s method of analysis has been verified against published BEIS figures using “hindcasting”. This shows the estimates for total electricity generation from fossil fuels or renewables to have been within ±3% of the BEIS number in each quarter since Q4 2017. (Data before then is not sufficient to carry out the Carbon Brief analysis.)

For example, in the second quarter of 2019, a Carbon Brief hindcast estimates gas generation at 33.1TWh, whereas the published BEIS figure was 34.0TWh. Similarly, it produces an estimate of 27.4TWh for renewables, against a BEIS figure of 27.1TWh.

National Grid recently shared its own analysis for electricity in Great Britain during 2019 via its energy dashboard, which differs from Carbon Brief’s figures.


Related News

View more

Brazil tax strategy to bring down fuel, electricity prices seen having limited effects

Brazil ICMS Tax Cap limits state VAT on fuels, natural gas, electricity, communications, and transit, promising short-term price relief amid inflation, with federal compensation to states and potential legal challenges affecting investments and ANP auctions.


Key Points

A policy capping state VAT at 17-18 percent on fuels, electricity, and services to temper prices and inflation.

✅ Caps VAT to 17-18% on fuels, power, telecom, transit

✅ Short-term relief; medium-long term impact uncertain

✅ Federal compensation; potential court challenges, investment risk


Brazil’s congress approved a bill that limits the ICMS tax rate that state governments can charge on fuels, natural gas, electricity, communications, and public transportation. 

Local lawyers told BNamericas that the measure may reduce fuel and power prices in the short term, similar to Brazil power sector relief loans seen during the pandemic, but it is unlikely to produce any major effects in the medium and long term. 

In most states the ceiling was set at 17% or 18% and the federal government will pay compensation to the states for lost tax revenue until December 31, via reduced payments on debts that states owe the federal government.

The bill will become law once signed by President Jair Bolsonaro, who pushed strongly for the proposal with an eye on his struggling reelection campaign for the October presidential election. Double-digit inflation has turned into a major election issue and fuel and electricity prices have been among the main inflation drivers, as seen in EU energy-driven inflation across the bloc this year. Congress’ approval of the bill is seen by analysts as political victory for the Brazilian leader.

How much difference will it make?

Marcus Francisco, tax specialist and partner at Villemor Amaral Advogados, said that in the formation of fuel and electricity prices there are other factors, including high natural gas prices, that drive increases.

“In the case of fuels, if the barrel of oil [price] increases, automatically the final price for the consumer will go up. For electricity, on the other hand, there are several subsidies and policy choices such as Florida rejecting federal solar incentives that are part of the price and that can increase the rate [paid],” he said. 

There is also a possibility that some states will take the issue to the supreme court since ICMS is a key source of revenue for them, Francisco added.

Tiago Severini, a partner at law firm Vieira Rezende, said the comparison between the revenue impact and the effective price reduction, based on the estimates made by the states and the federal government, seems disproportionate, and, as seen in Europe, rolling back European electricity prices is often tougher than it appears. 

“In other words, a large tax collection impact is generated, which is quite unequal among the different states, for a not so strong price reduction,” he said.

“Due to the lack of clarity regarding the precision of the calculations involved, it’s difficult even to assess the adequacy of the offsets the federal government has been considering, and international cases such as France's new electricity pricing scheme illustrate how complex it can be to align fiscal offsets with regulatory constraints, to cover the cost it would have with the compensation for the states” Severini added.

The compensation ideas that are known so far include hiking other taxes, such as the social contribution on net profits (CSLL) that is paid by oil and gas firms focused on exploration and production.

“This can generate severe adverse effects, such as legal disputes, reduced investments in the country, and reduced attractiveness of the new auctions by [sector regulator] ANP, and costly interventions like the Texas electricity market bailout after extreme weather events,” Severini said. 


Related News

View more

Negative Electricity Prices Amid Renewable Energy Surplus

France Negative Electricity Prices highlight surplus renewables as solar and wind output exceeds demand, driving grid flexibility, demand response, and storage signals while reshaping energy markets, lowering emissions, and improving economic efficiency and energy security.


Key Points

They occur when surplus solar and wind push wholesale power prices below zero, signaling flexible, low-carbon grids.

✅ Surplus solar and wind outpace demand, flipping price signals

✅ Incentivizes demand response, storage, and flexible loads

✅ Enhances decarbonization, energy security, and market efficiency


In a remarkable feat for renewable energy, France has recently experienced negative electricity prices due to an abundant supply of solar and wind power. This development highlights the country's progress towards sustainable energy solutions and underscores the potential of renewables to reshape global energy markets.

The Surge in Renewable Energy Supply

France's electricity grid benefited from a surplus of renewable energy generated by solar panels and wind turbines. During periods of peak production, such as sunny and windy days, the supply of electricity exceeded demand, leading to negative prices and reflecting how solar is reshaping price dynamics in Northern Europe.

Implications for Energy Markets

The occurrence of negative electricity prices reflects a shift towards a more flexible and responsive energy system. It demonstrates the capability of renewables to meet substantial portions of electricity demand reliably and economically, with evidence of falling wholesale prices in many markets, challenging traditional notions of energy supply and pricing dynamics.

Technological Advancements and Policy Support

Technological advancements in renewable energy infrastructure, coupled with supportive government policies and incentives, have played pivotal roles in France's achievement. Investments in solar farms, wind farms, and grid modernization, including the launch of France's largest battery storage platform by TagEnergy, have enhanced the efficiency and reliability of renewable energy integration into the national grid.

Economic and Environmental Benefits

The adoption of renewable energy sources not only reduces greenhouse gas emissions but also fosters economic growth and energy independence. By harnessing abundant solar and wind resources, France strengthens its energy security and reduces reliance on fossil fuels, contributing to long-term sustainability goals and reflecting a continental shift as renewable power has surpassed fossil fuels for the first time.

Challenges and Future Outlook

While France celebrates the success of negative electricity prices, challenges remain in scaling renewable energy deployment and optimizing grid management. Balancing supply and demand, integrating intermittent renewables, and investing in energy storage technologies are critical for ensuring grid stability and maximizing the benefits of renewable energy, particularly in addressing clean energy's curtailment challenge across modern grids.

Global Implications

France's experience with negative electricity prices serves as a model for other countries striving to transition to clean energy economies. It underscores the potential of renewables to drive economic prosperity, mitigate climate change impacts, and reshape global energy markets towards sustainability, as seen in Germany where solar-plus-storage is now cheaper than conventional power in several contexts.

Conclusion

France's achievement of negative electricity prices driven by renewable energy surplus marks a significant milestone in the global energy transition. By leveraging solar and wind power effectively, France demonstrates the feasibility and economic viability of renewable energy integration at scale. As countries worldwide seek to reduce carbon emissions and enhance energy resilience, France's example provides valuable insights and inspiration for advancing renewable energy agendas and accelerating towards a sustainable energy future.


Related News

View more

Philippines wants Canada's help to avoid China, U.S

Philippines-Canada Indo-Pacific Partnership strengthens ASEAN cooperation, maritime security, and South China Sea diplomacy, balancing U.S.-China rivalry through a rules-based order, trade diversification, and middle-power engagement to foster regional stability and sustainable growth.


Key Points

A strategic pact to balance U.S.-China rivalry, back ASEAN, and advance maritime security and a rules-based order

✅ Prioritizes ASEAN-led cooperation and regional diplomacy

✅ Supports maritime security and South China Sea stability

✅ Diversifies trade, infrastructure, energy, and education ties


The Philippines finds itself caught in a geopolitical tug-of-war between the United States and China, two superpowers with competing interests in the Indo-Pacific region. To navigate this complex situation, the Philippines is seeking closer ties with Canada, a middle power with a strong focus on diplomacy and regional cooperation and a deepening U.S.-Canada energy and minerals partnership that reinforces shared strategic interests.

The Philippines, like many Southeast Asian nations, desires peace and stability for continued economic growth. However, the intensifying rivalry between the U.S. and China threatens to disrupt this. Territorial disputes in the South China Sea, where China claims vast swathes of waters contested by the Philippines, are a major point of contention. The Philippines has a long-standing alliance with the U.S., whose current administration is viewed as better for Canada's energy sector by some observers, but it also has growing economic ties with China. This delicate balancing act is becoming increasingly difficult.

This is where Canada enters the picture. The Philippines sees Canada as a potential bridge between the two superpowers. Foreign Affairs Secretary Enrique Manalo emphasizes that the future of the Indo-Pacific shouldn't be dictated by "great power rivalry." Canada, with its emphasis on peaceful solutions and its strong relationships with both the U.S. and China, despite electricity exports at risk from periodic trade tensions, presents a welcome alternative.

There are several reasons why the Philippines views Canada as a natural partner. First, Canada's Indo-Pacific strategy prioritizes the Association of Southeast Asian Nations (ASEAN), a regional bloc that includes the Philippines, and reflects trade policy debates in Ottawa where Canadians support tariffs on energy and minerals. This focus on regional cooperation aligns with the Philippines' desire for a united ASEAN voice.

Second, Canada offers the Philippines opportunities for economic diversification. While China is a significant trading partner, the Philippines wants to lessen its dependence on any single power. Canada's expertise in areas like agriculture, infrastructure, education, and renewable energy aligns with the Philippines' clean energy commitment and development goals.

Third, Canada's experience in peacekeeping and maritime security can be valuable to the Philippines. The Philippines faces challenges in the South China Sea, and Canada's commitment to a rules-based international order resonates with the Philippines' desire for peaceful resolution of territorial disputes.

Canada, for its part, sees the Philippines as a strategically important partner in the Indo-Pacific. A stronger Philippines contributes to a more stable region, which aligns with Canada's own interests. Additionally, closer ties with the Philippines open doors for increased Canadian trade and investment in Southeast Asia, including in critical minerals supply chains and energy projects.

The Philippines' pursuit of a middle ground between the U.S. and China is not without its challenges. Balancing strong relationships with both powers requires careful diplomacy, even as tariff threats boost support for Canadian energy projects domestically. However, Canada's emergence as a potential partner offers the Philippines a much-needed counterweight and a path towards regional stability and economic prosperity.

By working together, Canada and the Philippines can promote peaceful solutions, strengthen regional cooperation, and ensure that the Indo-Pacific remains a place of opportunity for all nations, not just superpowers.


Related News

View more

Canada Makes Historic Investments in Tidal Energy in Nova Scotia

Canada Tidal Energy Investment drives Nova Scotia's PLAT-I floating tidal array at FORCE, advancing renewable energy, clean electricity, emissions reductions, and green jobs while delivering 9 MW of predictable ocean power to the provincial grid.


Key Points

Federal funding for a floating tidal array delivering 9 MW of clean power in Nova Scotia, cutting annual CO2 emissions.

✅ $28.5M for Sustainable Marine's PLAT-I floating array

✅ Delivers 9 MW to Nova Scotia's grid via FORCE

✅ Cuts 17,000 tonnes CO2 yearly and creates local jobs


Canada has an abundance of renewable energy sources that are helping power our country's clean growth future and the Government of Canada is investing in renewable energy and grid modernization to reduce emissions, create jobs and invigorate local economies in a post COVID-19 pandemic world.

The Honourable Seamus O'Regan, Canada's Minister of Natural Resources, today announced one of Canada's largest-ever investments in tidal energy development — $28.5 million to Sustainable Marine in Nova Scotia to deliver Canada's first floating tidal energy array.

Sustainable Marine developed an innovative floating tidal energy platform called PLAT-I as part of advances in ocean and river power technologies that has undergone rigorous testing on the waters of Grand Passage for nearly two years. A second platform is currently being assembled in Meteghan, Nova Scotia and will be launched in Grand Passage later this year for testing before relocation to the Fundy Ocean Research Centre for Energy (FORCE) in 2021. These platforms will make up the tidal energy array.  

The objective of the project is to provide up to nine megawatts of predictable and clean renewable electricity to Nova Scotia's electrical grid infrastructure. This will reduce greenhouse gas emissions by 17,000 tonnes of carbon dioxide a year while creating new jobs in the province. The project will also demonstrate the ability to harness tides as a reliable source of renewable electricity to power homes, vehicles and businesses.

Tidal energy — a clean, renewable energy source generated by ocean tides and currents, alongside evolving offshore wind regulations that support marine renewables — has the potential to significantly reduce Canada's greenhouse gas emissions and improve local air quality by displacing electricity generated from fossil fuels.

Minister O'Regan made the announcement at the Marine Renewables Canada 2020 Fall Forum, which brings together its members and industry to identify opportunities and strategize a path forward for marine renewable energy sources.

Funding for the project comes from Natural Resources Canada's Emerging Renewables Power Program, part of Canada's more than $180-billion Investing in Canada infrastructure plan for public transit projects, green infrastructure, social infrastructure, trade and transportation routes and Canada's rural and northern communities, as Prairie provinces' renewable growth accelerates nationwide.


Related News

View more

Sign Up for Electricity Forum’s Newsletter

Stay informed with our FREE Newsletter — get the latest news, breakthrough technologies, and expert insights, delivered straight to your inbox.

Electricity Today T&D Magazine Subscribe for FREE

Stay informed with the latest T&D policies and technologies.
  • Timely insights from industry experts
  • Practical solutions T&D engineers
  • Free access to every issue

Live Online & In-person Group Training

Advantages To Instructor-Led Training – Instructor-Led Course, Customized Training, Multiple Locations, Economical, CEU Credits, Course Discounts.

Request For Quotation

Whether you would prefer Live Online or In-Person instruction, our electrical training courses can be tailored to meet your company's specific requirements and delivered to your employees in one location or at various locations.