Summerside Wind Power reached 61% in May, blending renewable energy, municipal utility operations, and P.E.I. wind farms, driving city revenue, advancing green city goals, and laying groundwork for smart grid integration.
Key Points
Summerside Wind Power is the city utility's wind supply, 61% in May, generating revenue that supports local services.
✅ 61% of electricity in May from wind; annual target 45%.
✅ Mix of city-owned farm and West Cape Wind Farm contract.
✅ Revenues projected at $2.9M; funds municipal budget and services.
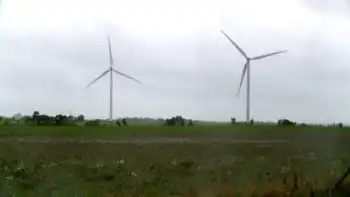
During the month of May, 61 per cent of the electricity Summerside's homes, businesses and industries used came from wind power sources.
25 per cent was purchased from the West Cape Wind Farm in West Point, P.E.I. — the city has had a contract with it since 2007. The other 36 per cent came from the city's own wind farm, which was built in 2009.
"One of the strategic goals that was planned for by the city back in 2005 was to try to become a 100 per cent green city," said Greg Gaudet, Summerside's director of municipal services.
"The city started looking at ways it could adopt green practices into its operations on everything it owns and operates and provides services to the community."
Summerside Electric powers about 6,200 residential, 970 commercial and 30 industrial customers and also sells to NB Power, while Nova Scotia Power now generates 30 per cent of its electricity from renewables.
The Summerside Wind Farm is owned by the City of Summerside, which then sells the electricity to Summerside Electric, which it also owns, for profit.
For the months of April and May, the wind farm generated $630,000 for the city. Last year, it was $507,000 over the same time frame, which does not include a 2 per cent rate increase imposed this year.
"We had a lot of good, strong days of wind for the month of May over other years. So normally we'd be on average somewhere in the range of the 45 per cent range for those months," said Gaudet.
The city's annual target for wind generation is also 45 per cent, which aligns with the view that more energy sources make better projects. Gaudet said it balances out over the year, with winter being the best and production dropping as low as 25 per cent in the summer months.
At Summerside council's monthly meeting on Monday, May's 61 per cent figure was touted as one of the highest months on record.
"To have one at 61 per cent means we had great production from our wind facilities and contracts, though communities such as Portsmouth have raised turbine noise and flicker concerns in other contexts," Gaudet said.
The utility also owns and provides power through a diesel generation plant.
Municipal money maker
The municipality projects its wind energy production will generate $2.9 million for the city in its current fiscal year, which began April 1, paralleling job gains seen in Alberta's renewables surge this year.
"Any revenues that are received from the wind farm facility goes into the City of Summerside budget," Gaudet said. "Then the council decides on how that money is accrued and where it goes and what it supports in the community."
Wind power generated $2.89 million for the city in the 2019-2020 fiscal year. The budget originally projected $3.2 million in revenue, but blade damage sustained during post-tropical storm Dorian put two turbines out of commission for a few weeks.
Gaudet called this their "only bad year" and officials said they see this year's target to be a bit more conservative and achievable regardless of hiccups and uncontrollable forces, such as the wind they're harnessing.
"It's performed outstandingly well," said Gaudet of the operation.
"There's been no huge, major cost factors with the wind farm to date ... its production has been fairly consistent from year to year."
Gaudet said the technology has already been piloted at a smaller operation at Credit Union Place, aligning with municipal solar power projects elsewhere.
The goal of the project is to bring Summerside's renewable portfolio up to a yearly average of 62 per cent. Gaudet said it's expected to be commissioned by May 2022 at the latest and after that, the city hopes to focus on smart grid technology.
"It's a long-term goal and I think it's the right [investment] to make," he said. "You have to be environmentally conscious and a steward of your community.
"I think Summerside is that and does that ... a model for North America to look at how a city can work a relationship with an electric utility for the betterment."
Related News