BC Utilities Commission Site C Dam Questions press BC Hydro on geotechnical risks, stability issues, cost overruns, oversight gaps, seeking transparency for ratepayers and clarity on contracts, mitigation, and the powerhouse and spillway foundations.
Key Points
Inquiry seeking explanations from BC Hydro on geotechnical risks, costs, timelines and oversight for Site C.
✅ Timeline of studies, monitoring, and mitigation actions
✅ Rationale for contracts, costs, and right bank construction
✅ Implications for ratepayers, oversight, and project stability
The watchdog B.C. Utilities Commission has sent BC Hydro 70 questions about the troubled Site C dam, asking when geotechnical risks were first identified and when the project’s assurance board was first made aware of potential issues related to the dam’s stability.
“I think they’ve come to the conclusion — but they don’t say it — that there’s been a cover-up by BC Hydro and by the government of British Columbia,” former BC Hydro CEO Marc Eliesen told The Narwhal.
On Oct. 21, The Narwhal reported that two top B.C. civil servants, including the senior bureaucrat who prepares Site C dam documents for cabinet, knew in May 2019 that the project faced serious geotechnical problems due to its “weak foundation” and the stability of the dam was “a significant risk.”
Get The Narwhal in your inbox!
People always tell us they love our newsletter. Find out yourself with a weekly dose of our ad‑free, independent journalism
“They [the civil servants] would have reported to their ministers and to the government in general,” said Eliesen, who is among 18 prominent Canadians calling for a halt to Site C work until an independent team of experts can determine if the geotechnical problems can be resolved and at what cost.
“It’s disingenuous for Premier [John] Horgan to try to suggest, ‘Well, I just found out about it recently.’ If that’s the case, he should fire the public servants who are representing the province.”
The public only found out about significant issues with the Site C dam at the end of July, when BC Hydro released overdue reports saying the project faces unknown cost overruns, schedule delays and, even as it achieved a transmission line milestone earlier, such profound geotechnical troubles that its overall health is classified as ‘red,’ meaning it is in serious trouble.
“The geotechnical challenges have been there all these years.”
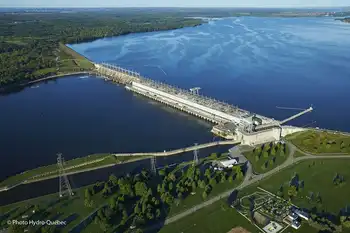
The Site C dam is the largest publicly funded infrastructure project in B.C.’s history. If completed, it will flood 128 kilometres of the Peace River and its tributaries, forcing families from their homes and destroying Indigenous gravesites, hundreds of protected archeological sites, some of Canada’s best farmland and habitat for more than 100 species vulnerable to extinction.
Eliesen said geotechnical risks were a key reason BC Hydro’s board of directors rejected the project in the early 1990s, when he was at the helm of BC Hydro.
“The geotechnical challenges have been there all these years,” said Eliesen, who is also the former Chair and CEO of Ontario Hydro, where Ontario First Nations have urged intervention on a critical electricity line, the former Chair of Manitoba Hydro and the former Chair and CEO of the Manitoba Energy Authority.
Elsewhere, a Manitoba Hydro line to Minnesota has faced potential delays, highlighting broader grid planning challenges.
The B.C. Utilities Commission is an independent watchdog that makes sure ratepayers — including BC Hydro customers — receive safe and reliable energy services, as utilities adapt to climate change risks, “at fair rates.”
The commission’s questions to BC Hydro include 14 about the “foundational enhancements” BC Hydro now says are necessary to shore up the Site C dam, powerhouse and spillways.
The commission is asking BC Hydro to provide a timeline and overview of all geotechnical engineering studies and monitoring activities for the powerhouse, spillway and dam core areas, and to explain what specific risk management and mitigation practices were put into effect once risks were identified.
The commission also wants to know why construction activities continued on the right bank of the Peace River, where the powerhouse would be located, “after geotechnical risks materialized.”
It’s asking if geotechnical risks played a role in BC Hydro’s decision in March “to suspend or not resume work” on any components of the generating station and spillways.
The commission also wants BC Hydro to provide an itemized breakdown of a $690 million increase in the main civil works contract — held by Spain’s Acciona S.A. and the South Korean multinational conglomerate Samsung C&T Corp. — and to explain the rationale for awarding a no-bid contract to an unnamed First Nation and if other parties were made aware of that contract.
Peace River Jewels of the Peace Site C The Narwhal
Islands in the Peace River, known as the ‘jewels of the Peace’ will be destroyed for fill for the Site C dam or will be submerged underwater by the dam’s reservoir, a loss that opponents are sharing with northerners in community discussions. Photo: Byron Dueck
B.C. Utilities Commission chair and CEO David Morton said it’s not the first time the commission has requested additional information after receiving BC Hydro’s quarterly progress reports on the Site C dam.
“Our staff reads them to make sure they understand them and if there’s anything in then that’s not clear we go then we do go through this, we call it the IR — information request — process,” Morton said in an interview.
“There are things reported in here that we felt required a little more clarity, and we needed a little more understanding of them, so that’s why we asked the questions.”
The questions were sent to BC Hydro on Oct. 23, the day before the provincial election, but Morton said the commission is extraordinarily busy this year and that’s just a coincidence.
“Our resources are fairly strained. It would have been nice if it could have been done faster, it would be nice if everything could be done faster.”
“These questions are not politically motivated,” Morton said. “They’re not political questions. There’s no reason not to issue them when they’re ready.”
The commission has asked BC Hydro to respond by Nov. 19.
Read more: Top B.C. government officials knew Site C dam was in serious trouble over a year ago: FOI docs
Morton said the independent commission’s jurisdiction is limited because the B.C. government removed it from oversight of the project.
The commission, which would normally determine if a large dam like the Site C project is in the public’s financial interest, first examined BC Hydro’s proposal to build the dam in the early 1980s.
After almost two years of hearings, including testimony under oath, the commission concluded B.C. did not need the electricity. It found the Site C dam would have negative social and environmental impacts and said geothermal power should be investigated to meet future energy needs.
The project was revived in 2010 by the BC Liberal government, which touted energy from the Site C dam as a potential source of electricity for California and a way to supply B.C.’s future LNG industry with cheap power.
Not willing to countenance another rejection from the utilities commission, the government changed the law, stripping the commission of oversight for the project. The NDP government, which came to power in 2017, chose not to restore that oversight.
“The approval of the project was exempt from our oversight,” Morton said. “We can’t come along and say ‘there’s something we don’t like about what you’re doing, we’re going to stop construction.’ We’re not in that position and that’s not the focus of these questions.”
But the commission still retains oversight for the cost of construction once the project is complete, Morton said.
“The cost of construction has to be recovered in [hydro] rates. That means BC Hydro will need our approval to recover their construction cost in rates, and those are not insignificant amounts, more than $10.7 billion, in all likelihood.”
In order to recover the cost from ratepayers, the commission needs to be satisfied BC Hydro didn’t spend more money than necessary on the project, Morton said.
“As you can imagine, that’s not a straight forward review to do after the fact, after a 10-year construction project or whatever it ends up being … so we’re using these quarterly reports as an opportunity to try to stay on top of it and to flag any areas where we think there may be areas we need to look into in the future.”
The price tag for the Site C dam was $10.7 billion before BC Hydro’s announcement at the end of July — a leap from $6.6 billion when the project was first announced in 2010 and $8.8 billion when construction began in 2015.
Eliesen said the utilities commission should have been asking tough questions about the Site C dam far earlier.
“They’ve been remiss in their due diligence activities … They should have been quicker in raising questions with BC Hydro, rather than allowing BC Hydro to be exceptionally late in submitting their reports.”
BC Hydro is late in filing another Site C quarterly report, covering the period from April 1 to June 30.
The quarterly reports provide the B.C. public with rare glimpses of a project that international hydro expert Harvey Elwin described as being more secretive than any hydro project he has encountered in five decades working on large dams around the world, including in China.
Read more: Site C dam secrecy ‘extraordinary’, international hydro construction expert tells court proceeding
Morton said the commission could have ordered regular reporting for the Site C project if it had its previous oversight capability.
“Then we would have had the ability to follow up and ultimately order any delinquent reports to be filed. In this circumstance, they are being filed voluntarily. They can file it as late as they choose. We don’t have any jurisdiction.”
In addition to the six dozen questions, the commission has also filed confidential questions with BC Hydro. Morton said confidential information could include things such as competitive bid information. “BC Hydro itself may be under a confidentiality agreement not to disclose it.”
With oversight, the commission would also have been able to drill down into specific project elements, Morton said.
“We would have wanted to ensure that the construction followed what was approved. BC Hydro wouldn’t have the ability to make significant changes to the design and nature of the project as they went along.”
BC Hydro has been criticized for changing the design of the Site C dam to an L-shape, which Eliesen said “has never been done anywhere in the world for an earthen dam.”
Morton said an empowered commission could have opted to hold a public hearing about the design change and engage its own technical consultants, as it did in 2017 when the new NDP government asked it to conduct a fast-tracked review of the project’s economics.
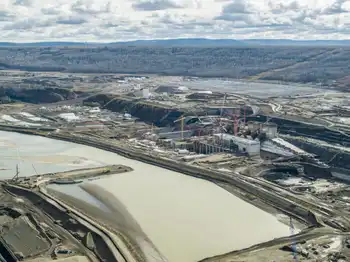
Construction Site C Dam
A recent report by a U.S. energy economist found cancelling the Site C dam project would save BC Hydro customers an initial $116 million a year, with increasing savings growing over time. Photo: Garth Lenz / The Narwhal
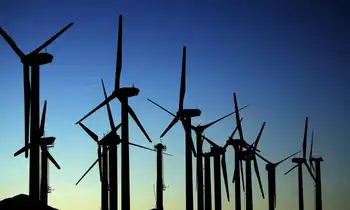
The commission’s final report found the dam could cost more than $12 billion, that BC Hydro had a historical pattern of overestimating energy demand and that the same amount of energy could be produced by a suite of renewables, including wind and proposed pumped storage such as the Meaford project, for $8.8 billion or less.
The NDP government, under pressure from construction trade unions, opted to continue the project, refusing to disclose key financial information related to its decision.
When the geotechnical problems were revealed in July, the government announced the appointment of former deputy finance minister Peter Milburn as a special Site C project advisor who will work with BC Hydro and the Site C project assurance board to examine the project and provide the government with independent advice.
Eliesen said BC Hydro and the B.C. government should never have allowed the recent diversion of the Peace River to take place given the tremendous geotechnical challenges the project faces and its unknown cost and schedule for completion.
“It’s a disgrace and scandalous,” he said. “You can halt the river diversion, but you’ve got another four or five years left in construction of the dam. What are you going to do about all the cement you’ve poured if you’ve got stability problems?”
He said it’s counter-productive to continue with advice “from the same people who have been wrong, wrong, wrong,” without calling in independent global experts to examine the geotechnical problems.
“If you stop construction, whether it takes three or six months, that’s the time that’s required in order to give yourself a comfort level. But continuing to do what you’ve been doing is not the right course. You should have to sit back.”
Eliesen said it reminded him of the Pete Seeger song Waist Deep in the Big Muddy, which tells the story of a captain ordering his troops to keep slogging through a river because they will soon be on dry ground. After the captain drowns, the troops turn around.
“It’s a reflection of the fact that if you don’t look at what’s new, you just keep on doing what you’ve been doing in the past and that, unfortunately, is what’s happening here in this province with this project.”
Related News