Substation Relay Protection Training
Our customized live online or in‑person group training can be delivered to your staff at your location.

- Live Online
- 12 hours Instructor-led
- Group Training Available
Regular Price:
$699
Coupon Price:
$599
Power company NRG Energy said it would join with Brightsource Energy to build and operate a the world's largest solar thermal plant and will invest up to $300 million to become the lead investor in the project.
The majority of solar power projects developed to date have been photovoltaic systems, in which sunlight is turned into electricity using semiconductor materials in panels, but several large-scale solar thermal, or concentrated solar, projects are in development.
Thermal solar power stations like the Brightsource project use mirrors to concentrate sunlight on a fixed point to heat a liquid that produces steam to power a turbine.
NRG, which previously announced a partnership to develop thermal solar plants with eSolar, said construction on the 392-megawatt Ivanpah project in the Mojave Desert had begun and was expected to be in operation by mid-2013.
Ivanpah has received a $1.375 billion conditional commitment from the U.S. Department of Energy for a loan guarantee, and has obtained all permits and approvals from both federal and California state agencies.
Related News
Texas Utilities back out of deal to create smart home electricity networks
Smart Meter Texas real-time pricing faces rollback as utilities limit on-demand reads, impacting demand response,…
View more

UN: Renewable Energy Ambition in NDCs must Double by 2030
NDC Renewable Energy Ambition drives COP25 calls to align with the Paris Agreement, as IRENA…
View more
End of an Era: UK's Last Coal Power Station Goes Offline
UK Coal-Free Energy Transition highlights the West Burton A closure, accelerating renewable energy, wind, solar,…
View more
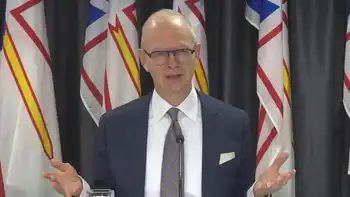
It's CHEAP but not necessarily easy: Crosbie introduces PCs' Newfoundland electricity rate reduction strategy
Crosbie Hydro Energy Action Plan outlines rate mitigation for Muskrat Falls, leveraging Nalcor oil revenues,…
View more
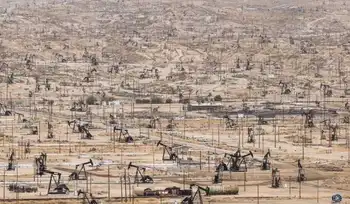
How Should California Wind Down Its Fossil Fuel Industry?
California Managed Decline of Fossil Fuels aligns oil phaseout with carbon neutrality, leveraging ZEV adoption,…
View more
Building begins on facility linking Canada hydropower to NYC
Champlain Hudson Power Express Converter Station brings Canadian hydropower via HVDC to Queens, converting 1,250…
View more
Sign Up for Electricity Forum’s Newsletter
Stay informed with our FREE Newsletter — get the latest news, breakthrough technologies, and expert insights, delivered straight to your inbox.
Electricity Today T&D Magazine Subscribe for FREE

Stay informed with the latest T&D policies and technologies.
- Timely insights from industry experts
- Practical solutions T&D engineers
- Free access to every issue

