Grid Transformer Waste Heat Recovery turns substations into neighborhood boilers, supplying district heating via heat networks, helping National Grid and SSE cut emissions, boost energy efficiency, and advance low carbon, net zero decarbonization.
Key Points
Grid Transformer Waste Heat Recovery captures substation heat for district heating, cutting emissions and gas use.
✅ Captures waste heat from National Grid transformers
✅ Feeds SSE district heat networks for nearby homes
✅ Cuts carbon, improves efficiency, aligns with net zero
Thousands of homes could soon be warmed by the heat from giant electricity grid transformers for the first time as part of new plans to harness “waste heat” and cut carbon emissions from home heating.
Trials are due to begin on how to capture the heat generated by transmission network transformers, owned by National Grid, to provide home heating for households connected to district heating networks operated by SSE.
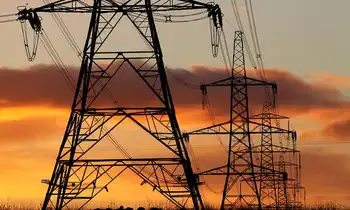
Currently, hot air is vented from the giant substations to help cool the transformers that help to control the electricity running through National Grid’s high-voltage transmission lines.
However, if the trial succeeds, about 1,300 National Grid substations could soon act as neighbourhood “boilers”, piping water heated by the substations into nearby heating networks, and on into the thousands of homes that use SSE’s services.
“Electric power transformers generate huge amounts of heat as a byproduct when electricity flows through them. At the moment, this heat is just vented directly into the atmosphere and wasted,” said Nathan Sanders, the managing director of SSE Energy Solutions.
“This groundbreaking project aims to capture that waste heat and effectively turn transformers into community ‘boilers’ that serve local heat networks with a low- or even zero-carbon alternative to fossil-fuel-powered heat sources such as gas boilers, a shift akin to a gas-for-electricity swap in heating markets,” Sanders added.
Alexander Yanushkevich, National Grid’s innovation manager, said the scheme was “essential to achieve net zero” and a “great example of how, taking a whole-system approach, including power-to-gas in Europe precedents, the UK can lead the way in helping accelerate decarbonisation”.
The energy companies believe the scheme could initially reduce heat network carbon emissions by more than 40% compared with fossil gas systems. Once the UK’s electricity system is zero carbon, and with recent milestones where wind was the main source of UK electricity on the grid, the heating solution could play a big role in helping the UK meet its climate targets.
The first trials have begun at National Grid’s specially designed testing site at Deeside in Wales to establish how the waste heat could be used in district heating networks. Once complete, the intellectual property will be shared with smaller regional electricity network owners, which may choose to roll out schemes in their areas.
Tim O’Reilly, the head of strategy at National Grid, said: “We have 1,300 transmission transformers, but there’s no reason why you couldn’t apply this technology to smaller electricity network transformers, too, echoing moves to use more electricity for heat in colder regions.”
Once the trials are complete, National Grid and SSE will have a better idea of how many homes could be warmed using the heat generated by electricity network substations, O’Reilly said, and how the heat can be used in ways that complement virtual power plants for grid resilience.
“The heavier the [electricity] load, which typically reaches a peak at around teatime, the more heat energy the transformer will be able to produce, aligning with times when wind leads the power mix nationally. So it fits quite nicely to when people require heat in the evenings,” he added.
Other projects designed to capture waste heat to use in district heating schemes include trapping the heat generated on the Northern line of London’s tube network to warm homes in Islington, and harnessing the geothermal heat from disused mines for district heating networks in Durham.
Only between 2% and 3% of the UK is connected to a district heating network, but more networks are expected to emerge in the years ahead as the UK tries to reduce the carbon emissions from homes, alongside its nuclear power plans in the wider energy strategy.
Related News