Canada Nuclear Power Expansion highlights SMRs, clean energy, net-zero targets, and robust regulation to deliver safe, reliable baseload electricity, spur investment, and economically decarbonize remote communities, mines, and grids across provinces securely.
Key Points
Canada Nuclear Power Expansion grows SMRs and reactors to meet climate targets with safe, reliable baseload power.
✅ Deploys SMRs for remote communities, mines, and industrial sites
✅ Streamlines regulation to ensure safety, trust, and timely approvals
✅ Provides clean, reliable baseload to hit net-zero electricity goals
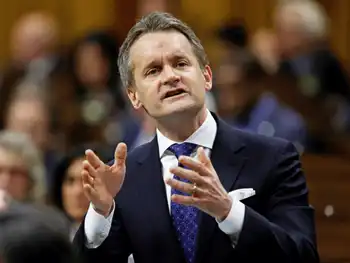
Canada must expand its nuclear power capacity if it is to reach its climate targets, according to Canadian Minister of Natural Resources Seamus Oregan.
Speaking to the Canadian Nuclear Association’s annual conference, Seamus O’Regan said the industry has to grow.
“As the world tackles a changing climate, nuclear power is poised to provide the next wave of clean, affordable, safe and reliable power,” he told a packed room.
The Ottawa conference was the largest the industry has run with dozens of companies and more than 900 people in attendance. Provincial cabinet ministers from Saskatchewan and Ontario were also there. Those two provinces, along with New Brunswick, signed a memorandum in December as part of a premiers' nuclear initiative to work together on small modular reactor technology.
People need to know that it’s safe
Small modular reactors are units that produce less power than large generating stations, but can be constructed easier and are expected to be safer to operate. Canadian firms have about a dozen of the proposed reactors working their way through the regulatory process, with New Brunswick's SMR plans drawing scrutiny.
The smaller reactors could be used in groups to replace large units, but the industry also hopes to use them in rural or isolated communities, mines or even oilsands projects, potentially replacing the diesel power generators some remote communities use.
The Canadian government issued a road map to support the industry in 2018 and O’Regan committed Thursday to putting some teeth on that proposal later this year, as provinces like Ontario explore new large-scale nuclear plants to meet demand, with specific steps the government will take.
“We have been working so hard to support this industry. We are placing nuclear energy front and centre, something that has never been done before.”
O’Regan said the government’s role is a clear, streamlined regulatory system that will promote the industry, but also help the Canadian public to trust the reactors will be safe.
“People need to know that it’s safe. They need to know that it’s regulated. They need to know that it’s safe for them,” he said.
The Liberals promised during the campaign that they would gradually reduce Canada’s carbon emissions even after hitting the targets in the Paris Agreement by 2030. By 2050, Prime Minister Justin Trudeau said he expects Canada to be carbon neutral, mindful of lessons from Europe's power crisis on reliability.
The government hasn’t outlined how it will achieve that goal. O’Regan said more detail is coming, but it’s clear that nuclear is going to have to play a major part, echoing the UK’s green industrial revolution approach to reactor deployment.
“I have not seen a credible plan for net zero without nuclear as part of the mix. I don’t think we are going to be relying on any one technology. I think it’s going to be a whole host of things.”
O’Regan said large investors are looking for countries that are on the path to net zero.
“Everybody has their shirt sleeves rolled up and we know we need to work on this, not only do we have to work on this for the urgency of the planet, but we have to work on it for Canadian jobs.”
He added, “We must focus on those areas where Canada can and should lead, like nuclear.”
Canadians are ready to take a fresh look at nuclear
John Gorman, president of the Canadian Nuclear Association, said he was thrilled with O’Regan’s comments.
“I took the minister’s remarks this morning as being perhaps the strongest language of support for the nuclear industry in a number of years.”
Gorman said the industry is in strong shape and is working with utility companies such as Ontario Power Generation and regulators to move projects forward.
“It’s this amazing collaboration and coordination that is enabling us to beat others to the roll out of these small modular reactors,” he said.
He said provinces that might not have looked at nuclear before now have an incentive to do it, because of climate change. A former solar industry executive, Gorman said solar and wind power are important, as Ontario plans to seek new wind and solar power to ease supply pressures, but they won’t be able to keep up with rising power demands.
“Globally we are seeing increased recognition that climate change is real and that it’s a crisis, we are also seeing recognition that we are not making as much progress on decarbonizing our electricity system as we thought,” he said. “Canadians are ready to take a fresh look at nuclear and see the real facts.”
Related News