High stakes at Bruce Power

By Toronto Star


NFPA 70b Training - Electrical Maintenance

Our customized live online or in‑person group training can be delivered to your staff at your location.

  • Live Online
  • 12 hours Instructor-led
  • Group Training Available
Regular Price:
$599
Coupon Price:
$499
Reserve Your Seat Today
A bit of gallows humour is appropriate perhaps when entering the concrete vault of a nuclear reactor.

"Welcome to the house of Count Dracula," says health physicist Maung Zeya. "Enter at your peril."

The out-of-service Candu reactor at the Bruce Power plant appears in the dingy light like a giant mechanical beehive. The air is hot and oppressive, and a handful of repairmen are at work.

Jack Rollins, a radiation official dressed head to toe in protective gear, stands 15 metres from the reactor and points a gun that detects gamma rays. It registers 18 millirems, a unit that measures the amount of radiation absorbed.

"What you see right there has already gone right through your body," says Rollins. "It's like an X-ray."

"Now watch this," he adds, moving his arm toward the reactor and noting the numbers on his gun shooting upwards.

It's an impressive display of the staying power of radiation, particularly since its source – uranium fuel bundles – was removed from the reactor 10 years ago.

But the residual dose is well below the yearly limit for Canadian nuclear workers, allowing them significant stretches of time up close to gut and renovate reactors at the Bruce A plant on the shores of Lake Huron.

The $5.2 billion project to fully refurbish four Candu reactors by 2013 is one of the biggest construction projects in Canada. Duncan Hawthorne, president and chief executive officer of privately owned Bruce Power, says the project will make or break Canada's nuclear industry.

"It's a destiny issue for the industry," Hawthorne says. "The success of this project spawns other projects and the failure of this probably means that we wouldn't want to do it again. Everybody knows what's at stake here."

Hawthorne, who also heads the North American branch of the World Association of Nuclear Operators, believes the outcome could also impact the industry in the U.S., which uses reactors other than Candus.

"If you're trying to borrow from financiers on the back of an unsuccessful project here, what are you going to say? `Well, that was Candu and it was those Canadians that don't know what they're doing?' That's not a very easy sell," he says.

The stakes are especially high in Ontario, where the Ontario Power Authority (OPA) wants to keep almost half of the province's electricity coming from nuclear plants during the next 20 years. That means spending $26.5 billion to renovate existing plants or build new ones.

Ontario's refurbishment record leaves little room for encouragement. Renovating and restarting just two Candu reactors at Pickering A, as taxpayers know, cost publicly-owned Ontario Power Generation $2.5 billion – wildly above the initial $800 million estimate to repair all four Pickering units.

But halfway through the first part of the Bruce project – a $2.7 billion plan to renovate reactors 1 and 2 – Hawthorne remains confident.

"We're on time and on budget," he says during an interview at Bruce Power's corporate offices on the sprawling nuclear site. "That's not to say that it's plain sailing. We'll have to fight our way through it."

The Ontario Power Authority, the agency that signed the much-debated contract with Bruce on behalf of the provincial government, concurs with Hawthorne's assessment.

"Our feeling is, if they're not on target, they're pretty close," says OPA spokesperson Tim Taylor.

Bolstering confidence is the fixed-price contracts Bruce Power signed with most of the contractors. Still, critics well versed with the Pickering refurbishment fiasco roll their eyes at early talk of success.

"The Candu is a bad design – it's a nightmare. The sooner we get rid of it the better," says Frank Greening, who examined weaknesses in the Candu's pressure tubes and feeder pipes while a senior chemist at OPG.

"Refurbishing old Candus is throwing money down a black hole," he adds, describing continued faith in the technology as "Canadians being pigheaded about a Canadian product that was good at one time but now is a lemon."

Critics note that OPG permanently mothballed two Pickering A reactors in 2005 because they were not worth fixing. The other two, which cost a fortune to renovate, have performed poorly since restarting in 2003 and 2005, and were shut down all summer for maintenance.

"The test is, do the (Bruce) units come on line on budget and on time, and how long do they stay on line?" says Mark Winfield, assistant professor of environmental studies at York University. "The record so far does not inspire confidence, to put it mildly."

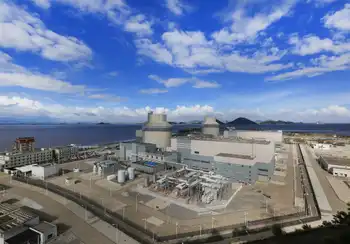
The Bruce nuclear site is a heavily guarded, 932-hectare complex 250 kilometres northwest of Toronto. It has two nuclear plants – Bruce A and B – each with four Candu reactors, ranging from 750 megawatts to 822 megawatts.

The six working reactors produce about 20 per cent of Ontario's electricity. When all eight are back on-line, the site's total output will be 6,200 megawatts, about 25 per cent of the province's power.

Burdened by debt, and with its nuclear program in disarray, OPG's precursor, Ontario Hydro, began shutting nuclear reactors in the late 1990s, including the four at Bruce A.

In 2001, OPG signed a long-term lease for the Bruce site with Bruce Power, a consortium today made up of uranium producer Cameco Corp., TransCanada PipeLines, the plant's two main unions, and BPC Generation Infrastructure Trust, owned by the Ontario Municipal Employees Retirement System.

By 2005, the consortium had restarted Bruce A reactors 3 and 4, a $720-million renovation project that Bruce initially thought would cost $340 million. Bruce officials blame the cost overrun, picked up wholly by the consortium, largely on security improvements imposed by the Canadian Nuclear Safety Commission after the 9/11 attacks in the U.S.

But Hawthorne makes clear there was more to it than that: "These are complicated animals to restart... restarting reactors is tough."

Also that year, Bruce Power sealed a deal with the provincial government to refurbish and restart three Bruce A reactors, and expanded it this summer to fully renovate the fourth.

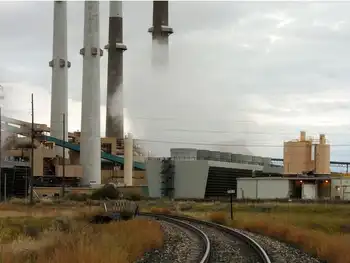
Ontario's increased need for power, coupled with the Liberal policy to phase out polluting coal-burning power plants, put the government in a weak negotiating position, according to an April report on the deal by provincial Auditor General Jim McCarter.

When subsidies are factored in, such as a rent reduction for Bruce Power and the government paying for Bruce's uranium fuel, the consortium is guaranteed between 6.3 and 7.1 cents per kilowatt hour for its electricity, McCarter concluded. That's well above the 4.9 cents average for the past five years and significantly above what private-sector experts believe the future price of electricity will be, he added.

"There's a definite cost to doing this sort of deal with the private sector," McCarter says in an interview, adding that the price of Bruce electricity will also increase annually, based on inflation.

"Consumers, you've got to be prepared. Your electricity bills are going up, and they're going up by a pretty healthy amount," he says.

Hawthorne is the poster boy of a beleaguered nuclear industry. After a decade of bad press from Ontario Hydro and OPG debacles, the industry rallied around the Porsche-driving nuclear executive with a Scottish accent. A framed picture in the reception area of his office shows him cradling an unused nuclear fuel bundle in his arms.

He doesn't hesitate to lambaste what he describes as a non-existent conservation culture – "We're a backwards province and a backwards country" – and sharply criticizes Canadian governments for what he says are their abysmal investments in research and development.

He's convinced he's at the forefront of a resurgent nuclear industry, dismissing worldwide examples to the contrary — a German law to phase out nuclear plants and an Italian moratorium on building new ones, to name only two — as temporary sops to public opinion.

"I'm not for nuclear world domination, I'm just recognizing that nuclear is a very significant part of the mix," says Hawthorne, whose consortium is also studying the building of new nuclear plants on the site.

He's equally convinced Bruce can avoid OPG's flawed record of refurbishing Candus or making them work at full capacity.

He suspects a lot of OPG's troubles involved a dysfunctional workplace culture.

He describes the collective agreement Bruce Power inherited as "the thickest you would find anywhere," a result, he believes, of a workplace where "no one trust(ed) anyone."

During a general meeting with employees, Hawthorne says he announced: "If I believe what I hear, I should sack all the managers for being incompetent and sack all you guys for being lazy. I don't believe any of that, and we've got to find a way to change that culture."

In the past, the plant's performance was also badly hit by poor management and a lack of best industry practices that prolonged maintenance when reactors unexpectedly shut down, Hawthorne says. Since Bruce Power took over, technical staff has been completely retrained.

"I know it's a tough project but we're just going to go on and get it done," he says, referring to the refurbishment. "I'd rather take the chance to fail than sit here in the wings without the opportunity."

Related News

Oil crash only a foretaste of what awaits energy industry

Oil and Gas Profitability Decline reflects shale-driven oversupply, OPEC-Russia dynamics, LNG exports, renewables growth, and weak demand, signaling compressed margins for producers, stressed petrodollar budgets, and shifting energy markets post-Covid.


Key Points

A sustained squeeze on hydrocarbon margins from agile shale supply, weaker OPEC leverage, and expanding renewables.

✅ Shale responsiveness caps prices and erodes industry rents

✅ OPEC-Russia cuts face limited impact versus US supply

✅ Renewables and EVs slow long-term oil and gas demand


The oil-price crash of March 2020 will probably not last long. As in 2014, when the oil price dropped below $50 from $110 in a few weeks, this one will trigger a temporary collapse of the US shale industry. Unless the coronavirus outbreak causes Armageddon, cheap oil will also support policymakers’ efforts to help the global economy.

But there will be at least one important and lasting difference this time round — and it has major market and geopolitical implications.

The oil price crash is a foretaste of where the whole energy sector was going anyway — and that is down.

It may not look that way at first. Saudi Arabia will soon realise, as it did in 2015, that its lethal decision to pump more oil is not only killing US shale but its public finances as well. Riyadh will soon knock on Moscow’s door again. Once American shale supplies collapse, Russia will resume co-operation with Saudi Arabia.

With the world economy recovering from the Covid-19 crisis by then, and with electricity demand during COVID-19 shifting, moderate supply cuts by both countries will accelerate oil market recovery. In time, US shale producers will return too.

Yet this inevitable bounceback should not distract from two fundamental factors that were already remaking oil and gas markets. First, the shale revolution has fundamentally eroded industry profitability. Second, the renewables’ revolution will continue to depress growth in demand.

The combined result has put the profitability of the entire global hydrocarbon industry under pressure. That means fewer petrodollars to support oil-producing countries’ national budgets, including Canada's oil sector exposures. It also means less profitable oil companies, which traditionally make up a large segment of stock markets, an important component of so many western pension funds.

Start with the first factor to see why this is so. Historically, the geological advantages that made oil from countries such as Saudi Arabia so cheap to produce were unique. Because oil and gas were produced at costs far below the market price, the excess profits, or “rent”, enjoyed by the industry were very large.

Furthermore, collusion among low-cost producers has been a winning strategy. The loss of market share through output cuts was more than compensated by immediately higher prices. It was the raison d’être of Opec.

The US shale revolution changed all this, exposing the limits of U.S. energy dominance narratives. A large oil-producing region emerged with a remarkable ability to respond quickly to price changes and shrink its costs over time. Cutting back cheap Opec oil now only increases US supplies, with little effect on world prices.

That is why Russia refused to cut production this month. Even if its cuts did boost world prices — doubtful given the coronavirus outbreak’s huge shock to demand — that would slow the shrinkage of US shale that Moscow wants.

Shale has affected the natural gas industry even more. Exports of US liquefied natural gas now put an effective ceiling on global prices, and debates over a clean electricity push have intensified when gas prices spike.

On top of all this, there is also the renewables’ revolution, though a green revolution has not been guaranteed in the near term. Around the world, wind and solar have become ever-cheaper options to generate electricity. Storage costs have also dropped and network management improved. Even in the US, renewables are displacing coal and gas. Electrification of vehicle fleets will damp demand further, as U.S. electricity, gas, and EVs face evolving pressures.

Eliminating fossil fuel consumption completely would require sustained and costly government intervention, and reliability challenges such as coal and nuclear disruptions add to the complexity. That is far from certain. Meanwhile, though, market forces are depressing the sector’s usual profitability.

The end of oil and gas is not immediately around the corner. Still, the end of hydrocarbons as a lucrative industry is a distinct possibility. We are seeing that in dramatic form in the current oil price crash. But this collapse is merely a message from the future.


Related News

View more

Tesla updates Supercharger billing to add cost of electricity use for other than charging

Tesla Supercharger Billing Update details kWh-based pricing that now includes HVAC, battery thermal management, and other HV loads during charging sessions, improving cost transparency across pay-per-use markets and extreme climate scenarios.


Key Points

Tesla's update bills for kWh used by HVAC, battery heating, and HV loads during charging, reflecting true energy costs.

✅ kWh charges now include HVAC and battery thermal management

✅ Expect 10-25 kWh increases in extreme climates during sessions

✅ Some regions still bill per minute due to regulations


Tesla has updated its Supercharger billing policy to add the cost of electricity use for things other than charging, like HVAC, battery thermal management, etc, while charging at a Supercharger station, a shift that impacts overall EV charging costs for drivers. 

For a long time, Tesla’s Superchargers were free to use, or rather the use was included in the price of its vehicles. But the automaker has been moving to a pay-to-use model over the last two years in order to finance the growth of the charging network amid the Biden-era charging expansion in the United States.

Not charging owners for the electricity enabled Tesla to wait on developing a payment system for its Supercharger network.

It didn’t need one for the first five years of the network, and now the automaker has been fine-tuning its approach to charge owners for the electricity they consume as part of building better charging networks across markets.

At first, it meant fluctuating prices, and now Tesla is also adjusting how it calculates the total power consumption.

Last weekend, Tesla sent a memo to its staff to inform them that they are updating the calculation used to bill Supercharging sessions in order to take into account all the electricity used:

The calculation used to bill for Supercharging has been updated. Owners will also be billed for kWhs consumed by the car going toward the HVAC system, battery heater, and other HV loads during the session. Previously, owners were only billed for the energy used to charge the battery during the charging session.

Tesla says that the new method should more “accurately reflect the value delivered to the customer and the cost incurred by Tesla,” which mirrors recent moves in its solar and home battery pricing strategy as well.

The automaker says that customers in “extreme climates” could see a difference of 10 to 25 kWh for the energy consumed during a charging session:

Owners may see a noticeable increase in billed kWh if they are using energy-consuming features while charging, e.g., air conditioning, heating etc. This is more likely in extreme climates and could be a 10-25 kWh difference from what a customer experienced previously, as states like California explore grid-stability uses for EVs during peak events.

Of course, this is applicable where Tesla is able to charge by the kWh for charging sessions. In some markets, regulations push Tesla to charge by the minute amid ongoing fights over charging control between utilities and private operators.

Electrek’s Take
It actually looks like an oversight from Tesla in the first place. It’s fair to charge for the total electricity used during a session, and not just what was used to charge your battery pack, since Tesla is paying for both, even as some states add EV ownership fees like the Texas EV fee that further shape costs.

However, I wish Tesla would have a clearer way to break down the charging sessions and their costs.

There have been some complaints about Tesla wrongly billing owners for charging sessions, and this is bound to create more confusion if people see a difference between the kWhs gained during charging and what is shown on the bill.


Related News

View more

Economic Crossroads: Bank Earnings, EV Tariffs, and Algoma Steel

Canada Economic Crossroads highlights bank earnings trends, interest rates, loan delinquencies, EV tariffs on Chinese imports, domestic manufacturing, Algoma Steel decarbonization, sustainability, and housing market risks shaping growth, investment, consumer prices, and climate policy.


Key Points

An overview of how bank earnings, EV tariffs, and Algoma Steel's transition shape Canada's economy.

✅ Higher rates lift margins but raise delinquencies and housing risks

✅ EV tariffs aid domestic makers but pressure consumer prices

✅ Algoma invests to decarbonize, boosting efficiency and compliance


In a complex economic landscape, recent developments have brought attention to several pivotal issues affecting Canada's business sector. The Globe and Mail’s latest report delves into three major topics: the latest bank earnings, the implications of new tariffs on Chinese electric vehicles (EVs), and Algoma Steel’s strategic maneuvers. These factors collectively paint a picture of the challenges and opportunities facing Canada's economy.

Bank Earnings Reflect Economic Uncertainty

The recent financial reports from major Canadian banks have revealed a mixed picture of the nation’s economic health. As the Globe and Mail reports, earnings results show robust performances in some areas while highlighting growing concerns in others. Banks have generally posted strong quarterly results, buoyed by higher interest rates which have improved their net interest margins. This uptick is largely attributed to the central bank's monetary policies aimed at combating inflation and stabilizing the economy.

However, the positive earnings are tempered by underlying economic uncertainties. Rising loan delinquencies and a slowing housing market are areas of concern. Increased interest rates, while beneficial for banks’ margins, have also led to higher borrowing costs for consumers and businesses. This dynamic has the potential to impact overall economic growth and consumer confidence.

Tariffs on Chinese EVs: A Strategic Shift

Another significant development is the imposition of new tariffs on Chinese electric vehicles. This move is part of a broader strategy to protect domestic automotive industries and address trade imbalances, aligning with public support for tariffs in key sectors. The tariffs are expected to increase the cost of Chinese EVs in Canada, which could have several implications for the market.

On one hand, the tariffs might provide a temporary boost to Canadian and North American manufacturers by reducing competition from lower-priced Chinese imports. This protectionist measure could encourage investments in local production and innovation, mirroring tariff threats boosting support for energy projects in other sectors. However, the increased cost of Chinese EVs may also lead to higher prices for consumers, potentially slowing the adoption of electric vehicles—a critical goal in Canada’s climate strategy.

The tariffs come at a time when the Canadian government is keen on accelerating the transition to electric mobility to meet its environmental targets, even as a critical crunch in electrical supply raises questions about grid readiness. Balancing the protection of domestic industries with the broader goal of reducing emissions will be a significant challenge moving forward.

Algoma Steel’s Strategic Evolution

In the steel industry, Algoma Steel has been making headlines with its strategic initiatives aimed at transforming its operations, in a broader shift toward clean grids and industrial decarbonization. The Globe and Mail highlights Algoma Steel's efforts to modernize its production processes and shift towards more sustainable practices. This includes significant investments in technology and infrastructure to enhance production efficiency and reduce environmental impact.

Algoma's focus on reducing carbon emissions aligns with broader industry trends towards sustainability. The company’s efforts are part of a larger push within the steel sector to address climate change and meet regulatory requirements. As one of Canada’s leading steel producers, Algoma’s actions could set a precedent for the industry, showcasing how traditional manufacturing sectors can adapt to evolving environmental standards.

Implications and Future Outlook

The interplay of these developments reflects a period of significant transition for Canada's economy, shaped in part by U.S. policy where Biden is seen as better for Canada's energy sector by some analysts. For banks, the challenge will be to navigate the balance between profitability and potential risks from a changing economic environment. The new tariffs on Chinese EVs represent a strategic shift with mixed implications for the automotive market, potentially influencing both domestic production and consumer prices. Meanwhile, Algoma Steel’s push towards sustainability could serve as a model for other industries seeking to align with environmental goals.

As these issues unfold, stakeholders across sectors will need to stay informed and adaptable. For policymakers, the challenge will be to support domestic industries while fostering innovation and sustainability, including the dilemma over electricity rates and innovation they must weigh. For businesses, the focus will be on navigating financial pressures and leveraging opportunities for growth. Consumers, in turn, will face the impact of these developments in their daily lives, from the cost of borrowing to the price of electric vehicles.

In summary, Canada’s current economic landscape is characterized by a blend of financial resilience, strategic adjustments, and evolving industry practices, amid policy volatility such as a tariff threat delaying Quebec's green energy bill earlier this year. As the country navigates these crossroads, the outcomes of these developments will play a crucial role in shaping the future economic environment.


Related News

View more

India's electricity demand falls at the fastest pace in at least 12 years

India Industrial Output Slowdown deepens as power demand slumps, IIP contracts, and electricity, manufacturing, and mining weaken; capital goods plunge while RBI rate cuts struggle to lift GDP growth, infrastructure, and fuel demand.


Key Points

A downturn where IIP contracts as power demand, manufacturing, mining, and capital goods fall despite RBI rate cuts.

✅ IIP fell 4.3% in Sep, worst since Feb 2013.

✅ Power demand dropped for a third month, signaling weak industry.

✅ Capital goods output plunged 20.7%, highlighting weak investment.


India's power demand fell at the fastest pace in at least 12 years in October, signalling a continued decline in the industrial output, mirroring how China's power demand dropped when plants were shuttered, according to government data. Electricity has about 8% weighting in the country's index for industrial production.

India needs electricity to fuel its expanding economy and has at times rationed coal supplies when demand surged, but a third decline in power consumption in as many months points to tapering industrial activity in a nation that aims to become a $5 trillion economy by 2024.

India's industrial output fell at the fastest pace in over six years in September, adding to a series of weak indicators that suggests that the country’s economic slowdown is deep-rooted and interest rate cuts alone may not be enough to revive growth.

Annual industrial output contracted 4.3% in September, government data showed on Monday. It was the worst performance since a 4.4% contraction in February 2013, according to Refinitiv data.

Analysts polled by Reuters had forecast industrial output to fall 2% for the month.

“A contraction of industrial production by 4.3% in September is serious and indicative of a significant slowdown as both investment and consumption demand have collapsed,” said Rupa Rege Nitsure, chief economist of L&T Finance Holdings.

The industrial output figure is the latest in a series of worrying economic data in Asia's third largest economy, which is also the world's third-largest electricity producer as well.

Economists say that weak series of data could mean economic growth for July-September period will remain near April-June quarter levels of 5%, which was a six-year low, and some analysts argue for rewiring India's electricity to bolster productivity. The Indian government is likely to release April-September economic growth figures by the end of this month.

Subdued inflation and an economic slowdown have prompted the Reserve Bank of India (RBI) to cut interest rates by a total of 135 basis points this year, while coal and electricity shortages eased in recent months.

“These are tough times for the RBI, as it cannot do much about it but there will be pressures on it to act ...Blunt tools like monetary policy may not be effective anymore,” Nitsure said.

Data showed in September mining sector fell 8.5%, while manufacturing and electricity fell 3.9% and 2.6% respectively, even as imported coal volumes rose during April-October. Capital goods output during the month fell 20.7%, indicating sluggish demand.

“IIP (Index of Industrial Production) growth in October 2019 is also likely to be in negative territory and only since November 2019 one can expect mild IIP expansion, said Devendra Kumar Pant, Chief Economist and Senior Director, Public Finance, India Ratings & Research (Fitch Group).

Infrastructure output, which comprises eight main sectors, in September showed a contraction of 5.2%, the worst in 14 years, even as global daily electricity demand fell about 15% during pandemic lockdowns.

India's fuel demand fell to its lowest in more than two years in September, with consumption of diesel to its lowest levels since January 2017. Diesel and gasoline together make up over 7.4% of the IIP weightage.

In 2019/20 India's fuel demand — also seen as an indicator of economic and industrial activity — is expected to post the slowest growth in about six years.


Related News

View more

Utilities see benefits in energy storage, even without mandates

Utility Battery Storage Rankings measure grid-connected capacity, not ownership, highlighting MW, MWh, and watts per customer across PJM, MISO, and California IOUs, featuring Duke Energy, IPL, ancillary services, and frequency regulation benefits.


Key Points

Rankings that track energy storage connected to utility grids, comparing MW, MWh, and W/customer rather than ownership.

✅ Ranks by MW, MWh, and watts per customer, not asset ownership

✅ Highlights PJM, MISO cases and California IOUs' deployments

✅ Examples: Duke Energy, IPL, IID; ancillary services, frequency response


The rankings do not tally how much energy storage a utility built or owns, but how much was connected to their system. So while IPL built and owns the storage facility in its territory, Duke does not own the 16 MW of storage that connected to its system in 2016. Similarly, while California’s utilities are permitted to own some energy storage assets, they do not necessarily own all the storage facilities connected to their systems.

Measured by energy (MWh), IPL ranked fourth with 20 MWh, and Duke Energy Ohio ranked eighth with 6.1 MWh.

Ranked by energy storage watts per customer, IPL and Duke actually beat the California utilities, ranking fifth and sixth with 42 W/customer and 23 W/customer, respectively.

Duke ready for next step

Given Duke’s plans, including projects in Florida that are moving ahead, the utility is likely to stay high in the rankings and be more of a driving force in development. “Battery technology has matured, and we are ready to take the next step,” Duke spokesman Randy Wheeless told Utility Dive. “We can go to regulators and say this makes economic sense.”

Duke began exploring energy storage in 2012, and until now most of its energy storage efforts were focused on commercial projects in competitive markets where it was possible to earn revenues. Those included its 36 MW Notrees battery storage project developed in partnership with the Department of Energy in 2012 that provides frequency regulation for the Electric Reliability Council of Texas market and two 2 MW storage projects at its retired W.C. Beckjord plant in New Richmond, Ohio, that sells ancillary services into the PJM Interconnection market.

On the regulated side, most of Duke’s storage projects have had “an R&D slant to them,” Wheeless said, but “we are moving beyond the R&D concept in our regulated territory and are looking at storage more as a regulated asset.”

“We have done the demos, and they have proved out,” Wheeless said. Storage may not be ready for prime time everywhere, he said, but in certain locations, especially where it can it can be used to do more than one thing, it can make sense.

Wheeless said Duke would be making “a number of energy storage announcements in the next few months in our regulated states.” He could not provide details on those projects.

More flexible resources
Location can be a determining factor when building a storage facility. For IPL, serving the wholesale market was a driving factor in the rationale to build its 20 MW, 20 MWh storage facility in Indianapolis.

IPL built the project to address a need for more flexible resources in light of “recent changes in our resource mix,” including decreasing coal-fired generation and increasing renewables and natural gas-fired generation, as other regions plan to rely on battery storage to meet rising demand, Joan Soller, IPL’s director of resource planning, told Utility Dive in an email. The storage facility is used to provide primary frequency response necessary for grid stability.

The Harding Street storage facility in May. It was the first energy storage project in the Midcontinent ISO. But the regulatory path in MISO is not as clear as it is in PJM, whereas initiatives such as Ontario storage framework are clarifying participation. In November, IPL with the Federal Energy Regulatory Commission, asking the regulator to find that MISO’s rules for energy storage are deficient and should be revised.

Soller said IPL has “no imminent plans to install energy storage in the future but will continue to monitor battery costs and capabilities as potential resources in future Integrated Resource Plans.”

California legislative and regulatory push

In California, energy storage did not have to wait for regulations to catch up with technology. With legislative and regulatory mandates, including CEC long-duration storage funding announced recently, as a push, California’s IOUs took high places in SEPA’s rankings.

Southern California Edison and San Diego Gas & Electric were first and fourth (63.2 MW and 17.2 MW), respectively, in terms of capacity. SoCal Ed and SDG&E were first and second (104 MWh and 28.4 MWh), respectively, and Pacific Gas and Electric was fifth (17 MWh) in terms of energy.

But a public power utility, the Imperial Irrigation District (IID), ended up high in the rankings – second in capacity (30 MW) and third  in energy (20 MWh) – even though as a public power entity it is not subject to the state’s energy storage mandates.

But while IID was not under state mandate, it had a compelling regulatory reason to build the storage project. It was part of a settlement reached with FERC over a September 2011 outage, IID spokeswoman Marion Champion said.

IID agreed to a $12 million fine as part of the settlement, of which $9 million was applied to physical improvements of IID’s system.

IID ended up building a 30 MW, 20 MWh lithium-ion battery storage system at its El Centro generating station. The system went into service in October 2016 and in May, IID used the system’s 44 MW combined-cycle natural gas turbine at the generating station.

Passing savings to customers
The cost of the storage system was about $31 million, and based on its experience with the El Centro project, Champion said IID plans to add to the existing batteries. “We are continuing to see real savings and are passing those savings on to our customers,” she said.

Champion said the battery system gives IID the ability to provide ancillary services without having to run its larger generation units, such as El Centro Unit 4, at its minimum output. With gas prices at $3.59 per million British thermal units, it costs about $26,880 a day to run Unit 4, she said.

IID’s territory is in southeastern California, an area with a lot of renewable resources. IID is also not part of the California ISO and acts as its own balancing authority. The battery system gives the utility greater operational flexibility, in addition to the ability to use more of the surrounding renewable resources, Champion said.

In May, IID’s board gave the utility’s staff approval to enter into contract negotiations for a 7 MW, 4 MWh expansion of its El Centro storage facility. The negotiations are ongoing, but approval could come in the next couple months, Champion said.

The heart of the issue, though, is “the ability of the battery system to lower costs for our ratepayers,” Champion said. “Our planning section will continue to utilize the battery, and we are looking forward to its expansion,” she said.” I expect it will play an even more important role as we continue to increase our percentage of renewables.”


Related News

View more

Wind has become the ‘most-used’ source of renewable electricity generation in the US

U.S. Wind Generation surpassed hydroelectric output in 2019, EIA data shows, becoming the top renewable electricity source, driven by PTC incentives, expanded capacity, and utility-scale projects across states, boosting the national electricity mix.


Key Points

U.S. Wind Generation is the nation's top renewable, surpassing hydro as EIA-tracked capacity grows under PTC incentives.

✅ EIA: wind topped hydro in 2019, over 300M MWh generated

✅ PTC credits spurred growth in utility-scale wind projects

✅ 103 GW installed; 77% added in the last decade


Last year saw wind power surging in the U.S. to overtake hydroelectric generation for the first time, according to data from the U.S. Energy Information Administration (EIA).

Released Wednesday, the figures from the EIA’s “Electric Power Monthly” report show that yearly wind generation hit a little over 300 million megawatt hours (MWh) in 2019. This was roughly 26 million MWh more than hydroelectric production.

Wind now represents the “most-used renewable electricity generation source” in the U.S., the EIA said, and renewables hit a 28% monthly record in April in later data.

Overall, total renewable electricity generation — which includes sources such as solar's 4.7% share in 2022 as one example, geothermal and landfill gas — at utility scale facilities hit more than 720 million MWh in 2019, compared to just under 707 million MWh in 2018. To put things in perspective, generation from coal came to more than 966 million MWh in 2019, while renewables surpassed coal in 2022 nationally according to later analyses.

According to the EIA’s “Today in Energy” briefing, which was also published Wednesday, generation from wind power has grown “steadily” across the last decade, and by 2020, renewables became the second-most prevalent source in the U.S. power mix.

This, it added, was partly down to the extension of the Production Tax Credit, or PTC, amid favorable government plans supporting solar and wind growth. According to the EIA, the PTC is a system which gives operators a tax credit per kilowatt hour of renewable electricity production. It applies for the first 10 years of a facility’s operation.

At the end of 2019, the country was home to 103 gigawatts (GW) of wind capacity, with 77% of this being installed in the last decade, and wind capacity surpassed hydro in 2016 according to industry data. The U.S. is home 80 GW of hydroelectric capacity, according to the EIA.

“The past decade saw a steady increase in wind capacity across the country and we capped the decade with a monumental achievement for the industry in reaching more than 100 GW,” Tom Kiernan, the American Wind Energy Association’s CEO, said in a statement issued Thursday.

“And more wind energy is coming, as the industry is well into investing $62 billion in new projects over the next few years that put us on the path to achieving 20 percent of the nation’s electricity mix in 2030,” Kiernan went on to state.

“As a result, wind is positioned to remain the largest renewable energy generator in the country for the foreseeable future.”


Related News

View more

Sign Up for Electricity Forum’s Newsletter

Stay informed with our FREE Newsletter — get the latest news, breakthrough technologies, and expert insights, delivered straight to your inbox.

Electricity Today T&D Magazine Subscribe for FREE

Stay informed with the latest T&D policies and technologies.
  • Timely insights from industry experts
  • Practical solutions T&D engineers
  • Free access to every issue

Live Online & In-person Group Training

Advantages To Instructor-Led Training – Instructor-Led Course, Customized Training, Multiple Locations, Economical, CEU Credits, Course Discounts.

Request For Quotation

Whether you would prefer Live Online or In-Person instruction, our electrical training courses can be tailored to meet your company's specific requirements and delivered to your employees in one location or at various locations.