Portugal expands wind power

By United Press International


CSA Z463 Electrical Maintenance -

Our customized live online or in‑person group training can be delivered to your staff at your location.

  • Live Online
  • 6 hours Instructor-led
  • Group Training Available
Regular Price:
$249
Coupon Price:
$199
Reserve Your Seat Today
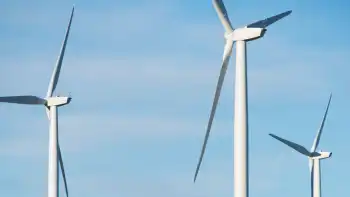
Portugal's General Directorate for Energy and Geology said wind power will provide 15 percent of the nation's electricity by 2010.

Currently, wind power represents about 4 percent of Portugal's electricity, but there are plans in place to increase that in coming years, Publico reported.

Portugal had 1,427 wind-powered generators at the end of August, generating 2,672 megawatts at 164 wind farms.

In addition, between January and August 2008, licenses were given for 384 megawatts of wind power, and wind power generation is expected to reach 2,800 megawatts by the end of the year.

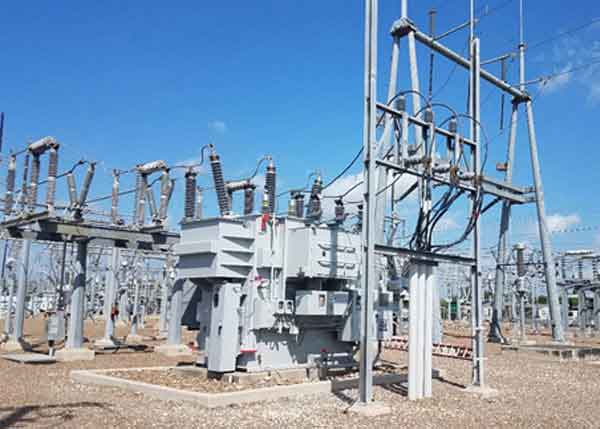
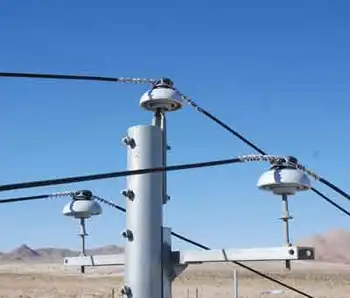
Portugal also uses hydroelectric power to generate renewable energy, particularly in the north. An estimated 9,653 megawatts of renewable energy is generated at electricity facilities in Portugal.

Related News

Covid-19: Secrets of lockdown lifestyle laid bare in electricity data

Lockdown Electricity Demand Trends reveal later mornings, weaker afternoons, and delayed peaks as WFH, streaming, and video conferencing reshape energy demand curves, grid forecasting, and residential electricity usage across Europe, New York, Tokyo, and Singapore.


Key Points

Shifts in power use during lockdowns: later ramps, weaker afternoons, and higher, delayed evening peaks.

✅ Morning ramp starts later; midday demand dips

✅ Evening peak shifts 1-2 hours; higher late-night usage

✅ WFH and streaming raise residential load; industrial demand falls


Life in lockdown means getting up late, staying up till midnight and slacking off in the afternoons.

That’s what power market data in Europe show in the places where restrictions on activity have led to a widespread shift in daily routines of hundreds of millions of people.

It’s a similar story wherever lockdowns bite. In New York City electricity use has fallen as much as 18% from normal times at 8am. Tokyo and three nearby prefectures had a 5% drop in power use during weekdays after Japan declared a state of emergency on April 7, according to Tesla Asia Pacific, an energy forecaster.

Italy’s experience shows the trend most clearly since the curbs started there on March 5, before any other European country. Data from the grid operator Terna SpA gives a taste of what other places are also now starting to report, with global daily demand dips observed in many markets as well.


1. People are sleeping later

With no commute to the office people can sleep longer. Normally, electricity demand began to pick up between 6 a.m. and 8 a.m. Now in Germany, it’s clear coffee machines don’t go on until between 8 a.m. and 9 a.m., said Simon Rathjen, founder of the trading company MFT Energy A/S.

Germany, France and Italy -- which between them make up almost two thirds of the euro-zone economy -- all have furlough measures that allow workers to receive a salary while temporarily suspended from their jobs. The U.K. also has a support package. Many of these workers will be getting up later.

"Now I have quite a relaxed start to the morning,” said David Freeman, an analyst in financial services from London. "I don’t get up until about half an hour before I need to start work.”

2. Less productive afternoons

There is a deeper dip in electricity use in the afternoons. Previously, power use rose between 2pm and 5pm. Now it dips as people head out for a walk or some air, according to UK demand data from National Grid Plc

It’s "as though we are living through a month of Sundays”, said Iain Staffell, senior lecturer in sustainable energy at Imperial College London.

3. Evenings in

From 6pm electricity use begins to rise steeply as people finish work and start chores. Restrictions like work and home schooling that prevent much daytime TV watching lifts in the early evening. This following chart for Germany shows the evening peak for power use coming during later hours.

The evening is when electricity use is highest, with most people confined to their homes. Netflix Inc reported a record 15.8 million paid subscribers – almost double the figure forecast by Wall Street analysts. Video-streaming services like Netflix and YouTube have found a captive audience. The new Disney+ service surpassed 50 million subscribers in just five months, a faster pace than predicted.

Internet traffic is skyrocketing, with a surge in bandwidth-intensive applications like streaming services and Zoom. This may mean that monthly broadband consumption of as much as 600 gigabytes, about 35% higher than before, according to Bloomberg Intelligence.

In Singapore, electricity use has dropped off significantly since the country’s "circuit-breaker” efforts to keep people at home began April 7. Electricity use has fallen and stayed low during the day. But late at night is a different story, as power demand fell sharply immediately after the lockdown began, it has steadily crept back in the past two weeks, perhaps a sign that Tiger King and The Last Dance have been finding late-night fans in the city state.

In Ottawa, COVID-19 closures made it seem as if the city had fallen off the electricity grid, according to local reports.

4. Staying up late

We’re going to bed later too. Demand doesn’t start to drop off until 10pm to 12am, at least an hour later than before.

"My children are definitely going to bed later,” said Liz Stevens, a teaching assistant from London. "Our whole routine is out the window.”

It’s challenging for those that need to predict behaviour – power grids and electricity traders. Forecasting is based on historical data, and there isn’t anything to go into the models gauging use now.

The closest we can get is looking at big events like football World Championships when people are all sitting down at the same time, according to Rathjen at MFT.

"Forecasting demand right now is very tricky,” said Chris Kimmett, director of power grids at Reactive Technologies Ltd. "A global pandemic is uncharted territory."

What normal looks like when the crisis passes is also an open question. Different countries are set to unravel their measures in their own ways, and global power demand has already surged above pre-pandemic levels in some analyses, with Germany and Austria loosening restrictions first and Italy remaining under tight control. Some changes may be permanent, with both workers and employers becoming more comfortable with working from home.

5. Different sectors consume more

In China, which is further along recovering from the pandemic than Europe or the US, the sharp contraction in overall power output masks a shift in daily routines.

Eating habits have changed. Restaurants are expanding delivery and even offering grocery services as the preference for dining at home persists. Household electricity consumption in China probably increased from activities such as cooking and heating, according to IHS Markit, which said that residential demand rose by 2.4% in the first two months as people stayed in.

The increase in technology use also drove China’s power demand from the telecom and web-service sectors to rise by 27%, the consultancy said.

Overall, China power demand in the first quarter of the year fell 6.5% from the same period in 2019 to 1.57 trillion kilowatt-hours, China’s National Energy Administration said last week. Industry uses about 70% of the country’s electricity, while the commercial sector and households account for 14% each. – Bloomberg


Related News

View more

UK low-carbon electricity generation stalls in 2019

UK low-carbon electricity 2019 saw stalled growth as renewables rose slightly, wind expanded, nuclear output fell, coal hit record lows, and net-zero targets demand faster deployment to cut CO2 intensity below 100gCO2/kWh.


Key Points

Low-carbon sources supplied 54% of UK power in 2019, up just 1TWh; wind grew, nuclear fell, and coal dropped to 2%.

✅ Wind up 8TWh; nuclear down 9TWh amid outages

✅ Fossil fuels 43% of generation; coal at 2%

✅ Net-zero needs 15TWh per year added to 2030


The amount of electricity generated by low-carbon sources in the UK stalled in 2019, Carbon Brief analysis shows.

Low-carbon electricity output from wind, solar, nuclear, hydro and biomass rose by just 1 terawatt hour (TWh, less than 1%) in 2019. It represents the smallest annual increase in a decade, where annual growth averaged 9TWh. This growth will need to double in the 2020s to meet UK climate targets while replacing old nuclear plants as they retire.

Some 54% of UK electricity generation in 2019 came from low-carbon sources, including 37% from renewables and 20% from wind alone, underscoring wind's leading role in the power mix during key periods. A record-low 43% was from fossil fuels, with 41% from gas and just 2% from coal, also a record low. In 2010, fossil fuels generated 75% of the total.

Carbon Brief’s analysis of UK electricity generation in 2019 is based on figures from BM Reports and the Department for Business, Energy and Industrial Strategy (BEIS). See the methodology at the end for more on how the analysis was conducted.

The numbers differ from those published earlier in January by National Grid, which were for electricity supplied in Great Britain only (England, Wales and Scotland, but excluding Northern Ireland), including via imports from other countries.

Low-carbon low
In 2019, the UK became the first major economy to target net-zero greenhouse gas emissions by 2050, increasing the ambition of its legally binding Climate Change Act.

To date, the country has cut its emissions by around two-fifths since 1990, with almost all of its recent progress coming from the electricity sector.

Emissions from electricity generation have fallen rapidly in the decade since 2010 as coal power has been almost phased out and even gas output has declined. Fossil fuels have been displaced by falling demand and by renewables, such as wind, solar and biomass.

But Carbon Brief’s annual analysis of UK electricity generation shows progress stalled in 2019, with the output from low-carbon sources barely increasing compared to a year earlier.

The chart below shows low-carbon generation in each year since 2010 (grey bars) and the estimated level in 2019 (red). The pale grey bars show the estimated future output of existing low-carbon sources after old nuclear plants retire and the pale red bars show the amount of new generation needed to keep electricity sector emissions to less than 100 grammes of CO2 per kilowatt hour (gCO2/kWh), the UK’s nominal target for the sector.

 Annual electricity generation in the UK by fuel, terawatt hours, 2010-2019. Top panel: fuel by fuel. Bottom panel: cumulative total generation from all sources. Source: BEIS energy trends, BM Reports and Carbon Brief analysis. Chart by Carbon Brief using Highcharts.
As the chart shows, the UK will require significantly more low-carbon electricity over the next decade as part of meeting its legally binding climate goals.

The nominal 100gCO2/kWh target for 2030 was set in the context of the UK’s less ambitious goal of cutting emissions to 80% below 1990 levels by 2050. Now that the country is aiming to cut emissions to net-zero by 2050, that 100gCO2/kWh indicator is likely to be the bare minimum.

Even so, it would require a rapid step up in the pace of low-carbon expansion, compared to the increases seen over the past decade. On average, low-carbon generation has risen by 9TWh each year in the decade since 2010 – including a rise of just 1TWh in 2019.

Given scheduled nuclear retirements and rising demand expected by the Committee on Climate Change (CCC) – with some electrification of transport and heating – low-carbon generation would need to increase by 15TWh each year until 2030, just to meet the benchmark of 100gCO2/kWh.

For context, the 3.2 gigawatt (GW) Hinkley C new nuclear plant being built in Somerset will generate around 25TWh once completed around 2026. The world’s largest offshore windfarm, the 1.2GW Hornsea One scheme off the Yorkshire coast, will generate around 5TWh each year.

The new Conservative government is targeting 40GW of offshore wind by 2030, up from today’s figure of around 8GW. If policies are put in place to meet this goal, then it could keep power sector emissions below 100gCO2/kWh, depending on the actual performance of the windfarms built.

However, new onshore wind and solar, further new nuclear or other low-carbon generation, such as gas with carbon capture and storage (CCS), is likely to be needed if demand is higher than expected, or if the 100gCO2/kWh benchmark is too weak in the context of net-zero by 2050.

The CCC says it is “likely” to “reflect the need for more rapid deployment” of low-carbon towards net-zero emissions in its advice on the sixth UK carbon budget for 2033-2037, due in September.

Trading places
Looking more closely at UK electricity generation in 2019, Carbon Brief’s analysis shows why there was so little growth for low-carbon sources compared to the previous year.

There was another increase for wind power in 2019 (up 8TWh, 14%), with record wind generation as several large new windfarms were completed including the 1.2GW Hornsea One project in October and the 0.6GW Beatrice offshore windfarm in Q2 of 2019. But this was offset by a decline for nuclear (down 9TWh, 14%), due to ongoing outages for reactors at Hunterston in Scotland and Dungeness in Kent.

(Analysis of data held by trade organisation RenewableUK suggests some 0.6GW of onshore wind capacity also started operating in 2019, including the 0.2GW Dorenell scheme in Moray, Scotland.)

As a result of these movements, the UK’s windfarms overtook nuclear for the first time ever in 2019, becoming the country’s second-largest source of electricity generation, and earlier, wind and solar together surpassed nuclear in the UK as momentum built. This is shown in the figure below, with wind (green line, top panel) trading places with nuclear (purple) and gas (dark blue) down around 25% since 2010 but remaining the single-largest source.

 Annual electricity generation in the UK by fuel, terawatt hours, 2010-2019. Top panel: fuel by fuel. Bottom panel: cumulative total generation from all sources. Source: BEIS energy trends, BM Reports and Carbon Brief analysis. Chart by Carbon Brief using Highcharts.
The UK’s currently suspended nuclear plants are due to return to service in January and March, according to operator EDF, the French state-backed utility firm. However, as noted above, most of the UK’s nuclear fleet is set to retire during the 2020s, with only Sizewell B in Suffolk due to still be operating by 2030. Hunterston is scheduled to retire by 2023 and Dungeness by 2028.

Set against these losses, the UK has a pipeline of offshore windfarms, secured via “contracts for difference” with the government, at a series of auctions. The most recent auction, in September 2019, saw prices below £40 per megawatt hour – similar to current wholesale electricity prices.

However, the capacity contracted so far is not sufficient to meet the government’s target of 40GW by 2030, meaning further auctions – or some other policy mechanism – will be required.

Coal zero
As well as the switch between wind and nuclear, 2019 also saw coal fall below solar for the first time across a full year, echoing the 2016 moment when wind outgenerated coal across the UK, after it suffered another 60% reduction in electricity output. Just six coal plants remain in the UK, with Aberthaw B in Wales and Fiddlers Ferry in Cheshire closing in March.

Coal accounted for just 2% of UK generation in 2019, a record-low coal share since centralised electricity supplies started to operate in 1882. The fuel met 40% of UK needs as recently as 2012, but has plummeted thanks to falling demand, rising renewables, cheaper gas and higher CO2 prices.

The reduction in average coal generation hides the fact that the fuel is now often not required at all to meet the UK’s electricity needs. The chart below shows the number of days each year when coal output was zero in 2019 (red line) and the two previous years (blue).

 Cumulative number of days when UK electricity generation from renewable sources has been higher than that from fossil fuels. Source: BEIS energy trends, BM Reports and Carbon Brief analysis. Chart by Carbon Brief using Highcharts.
The 83 days in 2019 with zero coal generation amount to nearly a quarter of the year and include the record-breaking 18-day stretch without the fuel.

Great Britain has been running for a record TWO WEEKS without using coal to generate electricity – the first time this has happened since 1882.

The country’s grid has been coal-free for 45% of hours in 2019 so far.https://www.carbonbrief.org/countdown-to-2025-tracking-the-uk-coal-phase-out …

Coal generation was set for significant reductions around the world in 2019 – including a 20% reduction for the EU as a whole – according to analysis published by Carbon Brief in November.

Notably, overall UK electricity generation fell by another 9TWh in 2019 (3%), bringing the total decline to 58TWh since 2010. This is equivalent to more than twice the output from the Hinkley C scheme being built in Somerset. As Carbon Brief explained last year, falling demand has had a similar impact on electricity-sector CO2 emissions as the increase in output from renewables.

This is illustrated by the fact that the 9TWh reduction in overall generation translated into a 9TWh (6%) cut in fossil-fuel generation during 2019, with coal falling by 10TWh and gas rising marginally.

Increasingly renewable
As fossil-fuel output and overall generation have declined, the UK’s renewable sources of electricity have continued to increase. Their output has risen nearly five-fold in the past decade and their share of the UK total has increased from 7% in 2010 to 37% in 2019.

As a result, the UK’s increasingly renewable grid is seeing more minutes, hours and days during which the likes of wind, solar and biomass collectively outpace all fossil fuels put together, and on some days wind is the main source as well.

The chart below shows the number of days during each year when renewables generated more electricity than fossil fuels in 2019 (red line) and each of the previous four years (blue lines). In total, nearly two-fifths of days in 2019 crossed this threshold.

 Cumulative number of days when the UK has not generated any electricity from coal. Source: BEIS energy trends, BM Reports and Carbon Brief analysis. Chart by Carbon Brief using Highcharts.
There were also four months in 2019 when renewables generated more of the UK’s electricity than fossil fuels: March, August, September and December. The first ever such month came in September 2018 and more are certain to follow.

National Grid, which manages Great Britain’s high-voltage electricity transmission network, is aiming to be able to run the system without fossil fuels by 2025, at least for short periods. At present, it sometimes has to ask windfarm operators to switch off and gas plants to start running in order to keep the electricity grid stable.

Note that biomass accounted for 11% of UK electricity generation in 2019, nearly a third of the total from all renewables. Some two-thirds of the biomass output is from “plant biomass”, primarily wood pellets burnt at Lynemouth in Northumberland and the Drax plant in Yorkshire. The remainder was from an array of smaller sites based on landfill gas, sewage gas or anaerobic digestion.

The CCC says the UK should “move away” from large-scale biomass power plants, once existing subsidy contracts for Drax and Lynemouth expire in 2027.

Using biomass to generate electricity is not zero-carbon and in some circumstances could lead to higher emissions than from fossil fuels. Moreover, there are more valuable uses for the world’s limited supply of biomass feedstock, the CCC says, including carbon sequestration and hard-to-abate sectors with few alternatives.

Methodology
The figures in the article are from Carbon Brief analysis of data from BEIS Energy Trends chapter 5 and chapter 6, as well as from BM Reports. The figures from BM Reports are for electricity supplied to the grid in Great Britain only and are adjusted to include Northern Ireland.

In Carbon Brief’s analysis, the BM Reports numbers are also adjusted to account for electricity used by power plants on site and for generation by plants not connected to the high-voltage national grid. This includes many onshore windfarms, as well as industrial gas combined heat and power plants and those burning landfill gas, waste or sewage gas.

By design, the Carbon Brief analysis is intended to align as closely as possible to the official government figures on electricity generated in the UK, reported in BEIS Energy Trends table 5.1.

Briefly, the raw data for each fuel is in most cases adjusted with a multiplier, derived from the ratio between the reported BEIS numbers and unadjusted figures for previous quarters.

Carbon Brief’s method of analysis has been verified against published BEIS figures using “hindcasting”. This shows the estimates for total electricity generation from fossil fuels or renewables to have been within ±3% of the BEIS number in each quarter since Q4 2017. (Data before then is not sufficient to carry out the Carbon Brief analysis.)

For example, in the second quarter of 2019, a Carbon Brief hindcast estimates gas generation at 33.1TWh, whereas the published BEIS figure was 34.0TWh. Similarly, it produces an estimate of 27.4TWh for renewables, against a BEIS figure of 27.1TWh.

National Grid recently shared its own analysis for electricity in Great Britain during 2019 via its energy dashboard, which differs from Carbon Brief’s figures.


Related News

View more

Calgary's electricity use soars in frigid February, Enmax says

Calgary Winter Energy Usage Surge highlights soaring electricity demand, added megawatt-hours, and grid reliability challenges driven by extreme cold, heating loads, and climate change, with summer air conditioning also shifting seasonal peaks.


Key Points

A spike in Calgary's power use from extreme cold, adding 22k MWh and testing reliability as heating demand rises.

✅ +22,000 MWh vs Feb 2018 amid fourth-coldest February

✅ Heating loads spike; summer A/C now drives peak demand

✅ Grid reliability monitored; more solar and green resources ahead


February was so cold in Calgary that the city used enough extra energy to power 3,400 homes for a whole year, echoing record-breaking demand in B.C. in 2021 during severe cold.

Enmax Power Corporation, the primary electricity utility in the city, says the city 's energy consumption was up 22,000 megawatt hours last month compared with Februray 2018.

"We've seen through this cold period our system has held up very well. It's been very reliable," Enmax vice-president Andre van Dijk told the Calgary Eyeopener on Friday. "You know, in the absence of a windstorm combined with cold temperatures and that sort of thing, the system has actually held up pretty well."

The past month was the fourth coldest in Calgary's history, and similar conditions have pushed all-time high demand in B.C. in recent years across the West. The average temperature for last month was –18.1 C. The long-term average for February is –5.4 C.


Watching use, predicting issues

The electricity company monitors demand and load on a daily basis, always trying to predict issues before they happen, van Dijk said, and utilities have introduced winter payment plans to help customers manage bills during prolonged cold.

One of the issues they're watching is climate change, and how extreme temperatures and weather affect both the grid's reliability, as seen when Quebec shattered consumption records during cold snaps, and the public's energy use.

The colder it gets, the higher you turn up the heat. The hotter it is, the more you use air conditioning.

He also noted that using fuels then contributes to climate change, creating a cycle.

​"We are seeing variations in temperature and we've seen large weather events across the continent, across the world, in fact, that impact electrical systems, whether that's flooding, as we've experienced here, or high winds, tornadoes," van Dijk said.

"Climate change and changing weather patterns have definitely had had an impact on us as an electrical industry."

In 2012, he said, Calgary switched from using the most power during winter to using the most during summer, in large part due to air conditioning, he said.

"Temperature is a strong influencer of energy consumption and of our demand," van Dijk said.

Christmas tree lights have also become primarily LED, van Dijk said, which cuts down on a big energy draw in the winter.

He said he expects more solar and other green resources will be added into the electrical system in the future to mitigate how much the increasingly levels of energy use impact climate change, and to help moderate electricity costs in Alberta over time.


Related News

View more

Energy crisis: EU outlines possible gas price cap strategies

EU Gas Price Cap Strategies aim to curb inflation during an energy crisis by capping wholesale gas and electricity generation costs, balancing supply and demand, mitigating subsidies, and safeguarding supply security amid Russia-Ukraine shocks.


Key Points

Temporary EU measures to cap gas and power prices, curb inflation, manage demand, and protect supply security.

✅ Flexible temporary price limits to secure gas supplies

✅ Framework cap on gas for electricity generation with demand checks

✅ Risk: subsidies, higher demand, and market distortions


The European Commission has outlined possible strategies to cap gas prices as the bloc faces a looming energy crisis this winter. 

Member states are divided over the emergency measures designed to pull down soaring inflation amid Russia's war in Ukraine. 

One proposal is a temporary "flexible" limit on gas prices to ensure that Europe can continue to secure enough gas, EU energy commissioner Kadri Simson said on Tuesday. 

Another option could be an EU-wide "framework" for a price cap on gas used to generate electricity, which would be combined with measures to ensure gas demand does not rise as a result, she said.

EU leaders are meeting on Friday to debate gas price cap strategies amid warnings that Europe's energy nightmare could worsen this winter.

Last week, France, Italy, Poland and 12 other EU countries urged the Commission to propose a broader price cap targeting all wholesale gas trade. 

But Germany -- Europe's biggest gas buyer -- and the Netherlands are among those opposing electricity market reforms within the bloc.

Russia has slashed gas deliveries to Europe since its February invasion of Ukraine, with Moscow blaming the cuts on Western sanctions imposed in response to the invasion, as the EU advances a plan to dump Russian energy across the bloc.

Since then, the EU has agreed on emergency laws to fill gas storage and windfall profit levies to raise money to help consumers with bills. 

Price cap critics
One energy analyst told Euronews that an energy price cap was an "unchartered territory" for the European Union. 

The EU's energy sector is largely liberalised and operates under the fundamental rules of supply and demand, making rolling back electricity prices complex in practice.

"My impression is that member states are looking at prices and quantities in isolation and that's difficult because of economics," said Elisabetta Cornago, a senior energy researcher at the Centre for European Reform.

"It's hard to picture such a level of market intervention This is uncharted territory."

The energy price cap would "quickly start costing billions" because it would force governments to continually subsidise the difference between the real market price and the artificially capped price, another expert said. 

"If you are successful and prices are low and you still get gas, consumers will increase their demand: low price means high demand. Especially now that winter is coming," said Bram Claeys, a senior advisor at the Regulatory Assistance Project. 


Related News

View more

BC Hydro rebate and B.C. Affordability Credit coming as David Eby sworn in as premier

BC Affordability & BC Hydro Bill Credits provide inflation relief and cost of living support, lowering electricity bills for families and small businesses through automatic utility credits and income-tested tax rebates across British Columbia.


Key Points

BC relief lowering electricity bills and offering rebates to help families and businesses facing inflation.

✅ $100 credit for residential BC Hydro users; applied automatically.

✅ Avg $500 bill credit for small and medium commercial customers.

✅ Income-based BC Affordability Credit via CRA in January.


The new B.C. premier announced on Friday morning families and small businesses in B.C. will get a one-time cost of living credit on their BC Hydro bill this fall, and a new B.C. Affordability Credit in January.

Eby focused on the issue of affordability in his speech following being sworn in as B.C.’s 37th premier, including electricity costs addressed by BC Hydro review recommendations that aim to keep power affordable.

A BC Hydro bill credit of $100 will be provided to all eligible residential and commercial electricity customers, including those who receive their electricity service indirectly from BC Hydro through FortisBC or a municipal utility.

“People and small businesses across B.C. are feeling the squeeze of global inflation,” Eby said.

“It’s a time when people need their government to continue to be there for them. That’s why we’re focused on helping people most impacted by the rising costs we’re seeing around the world – giving people a bit of extra credit, especially at a time of year when expenses can be quick to add up.”

Eby takes over as premier of the province with a growing number of concerns piling up on his plate, even as the province advances grid development and job creation projects to support long-term growth.

Economists in the province have warned of turbulent economic times ahead due to global economic pressures and power supply challenges tied to green energy ambitions.

The one-time $100 cost of living credit works out to approximately one month of electricity for a family living in a detached home or more than two months of electricity for a family living in an apartment.

Commercial ratepayers, including small and medium businesses like restaurants and tourism operators, will receive a one-time bill credit averaging $500 as B.C. expands EV charging infrastructure to accelerate electrification.

The amount will be based on their prior year’s electricity consumption.

British Columbians will have the credit automatically applied to their electricity accounts.

BC Hydro customers will have the credit applied in early December. Customers of FortisBC and municipal utilities will likely begin to see their bill credits applied early in the new year.

‘I proudly and unreservedly turn to the tallest guy in the room’: John Horgan on David Eby

The B.C. Affordability Credit is separate and will be based on income.

Eligible people and families will automatically receive the new credit through the Canada Revenue Agency, the same way the enhanced Climate Action Tax Credit was received in October.

An eligible person making an income of up to $36,901 will receive the maximum BC Affordability Credit with the credit fully phasing out at $79,376.

An eligible family of four with a household income of $43,051 will get the maximum amount, with the credit fully phasing out by $150,051.

This additional support means a family of four can receive up to an additional $410 in early January 2023 to help offset some of the added costs people are facing, while EV owners can access more rebates for home and workplace charging to reduce transportation expenses.

“Look for B.C.’s new Affordability Credit in your bank account in January 2023,” Eby said.

“We know it won’t cover all the bills, but we hope the little bit extra helps folks out this winter.”

Eby’s swearing-in marks a change at the premier’s office but not a shift in focus.

The premier expects to continue on with former premier John Horgan’s mandate with a focus on affordability issues and clean growth supported by green energy investments from both levels of government.

In a ceremony held in the Musqueam Community Centre, Eby made a commitment to make meaningful improvements in the lives of British Columbians and continue work with First Nations communities, with clean-tech growth underscored by the B.C. battery plant announcement made with the prime minister.

The ceremony was the first-ever swearing-in hosted by a First Nation in British Columbia.

“British Columbia is a wonderful place to call home,” Eby said.

“At the same time, people are feeling uncertain about the future and worried about their families. I’m proud of the work done by John Horgan and our government to put people first. And there’s so much more to do. I’m ready to get to work with my team to deliver results that people will be able to see and feel in their lives and in their communities.”


Related News

View more

Florida Court Blocks Push to Break Electricity Monopolies

Florida Electricity Deregulation Ruling highlights the Florida Supreme Court decision blocking a ballot measure on retail choice, preserving utility monopolies for NextEra and Duke Energy, while similar deregulation efforts arise in Virginia and Arizona.


Key Points

A high court decision removing a retail choice ballot measure, keeping Florida utility monopolies intact for incumbents.

✅ Petition language deemed misleading for 2020 ballot

✅ Preserves NextEra and Duke Energy market dominance

✅ Similar retail choice pushes in VA and AZ


Florida’s top court ruled against a proposed constitutional amendment that would have allowed customers to pick their electricity provider, even as Florida solar incentives face rejection by state leaders, threatening monopolies held by utilities such as NextEra Energy Inc. and Duke Energy Corp.

In a ruling Thursday, the court said the petition’s language is “misleading” and doesn’t comply with requirements to be included on the 2020 ballot, reflecting debates over electricity pricing changes at the federal level. The measure’s sponsor, Citizens for Energy Choice, said the move ends the initiative, even as electricity future advocacy continues nationwide.

“While we were confident in our plan to gather the remaining signatures required, we cannot overcome this last obstacle,” the group’s chair, Alex Patton, noting ongoing energy freedom in the South efforts, said in a statement.

The proposed measure was one of several efforts underway to deregulate U.S. electricity markets, including New York’s review of retail energy markets this year. Earlier this week, two Virginia state lawmakers unveiled a bill to allow residents and businesses to pick their electricity provider, threatening Dominion Energy Inc.’s longstanding local monopoly. And in Arizona, where Arizona Public Service Co. has long reigned, regulators are considering a similar move, while in New England Hydro-Quebec’s export bid has been energized by a court decision.


Related News

View more

Sign Up for Electricity Forum’s Newsletter

Stay informed with our FREE Newsletter — get the latest news, breakthrough technologies, and expert insights, delivered straight to your inbox.

Electricity Today T&D Magazine Subscribe for FREE

Stay informed with the latest T&D policies and technologies.
  • Timely insights from industry experts
  • Practical solutions T&D engineers
  • Free access to every issue

Download the 2025 Electrical Training Catalog

Explore 50+ live, expert-led electrical training courses –

  • Interactive
  • Flexible
  • CEU-cerified