CSA Z462 Arc Flash Training – Electrical Safety Compliance Course
Our customized live online or in‑person group training can be delivered to your staff at your location.

- Live Online
- 6 hours Instructor-led
- Group Training Available
Regular Price:
$249
Coupon Price:
$199
In a throwback to the days when a young firebrand named Paul Wellstone helped organize rural powerline protests, the people who run south metro townships in the path of a new generation of major powerlines are inviting landowners to a session with energy activists to talk about their options.
"It's different from then and yet it's similar," said George Crocker, a Wellstone ally who is among the featured speakers. "This is the first major sort of system-wide attempt to expand transmission system since the boom cycle of the '70s."
After months of low-key efforts to inform landowners of what may be about to hit them, the tempo is starting to quicken: Key public information sessions on the need for the line are coming up soon. This week's session, organized by the Dakota County Association of Townships, will be a clash of dueling interests. Utility companies have been invited, and will stress the rising demand for power in a vibrant region.
But the bulk of the time will be given to activists, who are expected to encourage resistance to what they describe as profit-motivated, old-fashioned thinking.
The utilities say they welcome the session.
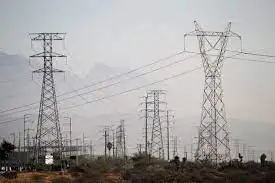
"We are excited that Eureka Township took the initiative to set something up themselves," said Tim Carlsgaard, spokesman for CapX 2020, the coalition of utilities backing the proposed lines. The companies are seeking state approval for a cluster of major lines. Two of them - 345-kilovolt lines with towers as high as 150 feet, one stretching 230 miles west to South Dakota and the other 150 miles southward to Wisconsin - would cross Dakota County.
No specific pathway has yet been laid down, but the general outlines of the corridors - mostly 10 to 12 miles wide - are clear. Points of controversy are expected to include whether the lines are needed, whether they pose health risks and how much landowners should be paid.
The forum is pointedly designed to be free from corporate control, said Hank Tressel, executive director of the townships group.
"Some people feel that Great River Energy is controlling things," he added, meaning the company managing the proposal for the line to South Dakota.
An invitation posted on the website of Eureka Township, south of Lakeville, notes that some of those attending recent informational meetings arranged by the utility companies "discovered there are lots of pieces to the project that are hard to understand and... found it difficult to get answers to some of your more detailed questions."
Carlsgaard said the utilities are pleased so far by public reaction at dozens of open houses across much of the state. About 1,800 people turned out, he said, and "seemed understanding about the need. There've been no protests, or anything like that.
"It would have been nice to have more come out," he said, "but it's early yet. People are busy. Until they really know where the line will run, there's not as much desire to take part."
Crocker said his pitch will center on the importance of getting as much as possible out of the current system of powerlines - including energy conservation - before building new ones.
With lines hundreds of miles long, he said, a lot of energy goes to waste, and wind farms injecting energy along the route could make them much more efficient.
"We need to think about these things in new ways," he said. With multiple major new lines in store, he added, "People are starting to come to grips with what it really takes to keep the lights on."
Related News

Manitoba Hydro's burgeoning debt surpasses $19 billion
Manitoba Hydro Debt Load surges past $19.2B as the Crown corporation faces shrinking net income,…
View more
Almost 500-mile-long lightning bolt crossed three US states
Longest Lightning Flash Record confirmed by WMO: a 477.2-mile megaflash spanning Mississippi, Louisiana, and Texas,…
View more
US Electricity Prices Rise Most in 41 Years as Inflation Endures
US Electricity Price Surge drives bills as BLS data show 15.8 percent jump; natural gas…
View more

How vehicle-to-building charging can save costs, reduce GHGs and help balance the grid: study
Ontario EV Battery Storage ROI leverages V2B, V2G, two-way charging, demand response, and second-life batteries…
View more
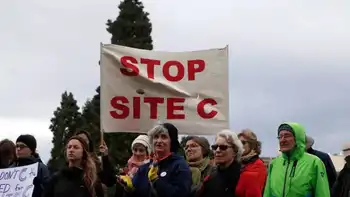
Site C dam could still be cancelled at '11th hour' if First Nations successful in court
Site C Dam Court Ruling could halt hydroelectric project near Fort St. John, as First…
View more

The UK’s energy plan is all very well but it ignores the forecast rise in global sea-levels
UK Marine Energy and Climate Resilience can counter sea level rise and storm surge with…
View more
Sign Up for Electricity Forum’s Newsletter
Stay informed with our FREE Newsletter — get the latest news, breakthrough technologies, and expert insights, delivered straight to your inbox.
Electricity Today T&D Magazine Subscribe for FREE

Stay informed with the latest T&D policies and technologies.
- Timely insights from industry experts
- Practical solutions T&D engineers
- Free access to every issue
