Substation Relay Protection Training
Our customized live online or in‑person group training can be delivered to your staff at your location.

- Live Online
- 12 hours Instructor-led
- Group Training Available
Regular Price:
$699
Coupon Price:
$599
LONDON
—
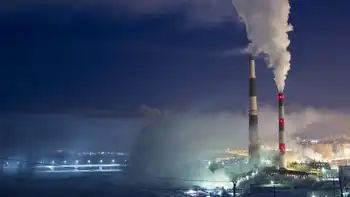
Rising Greenhouse Gas Concentrations drive climate change, with CO2, methane, and nitrous oxide surging; WMO data show higher radiative forcing, elevated pre-industrial baselines, and persistent atmospheric concentrations despite Paris Agreement emissions pledges.
In This Story
Increasing atmospheric CO2, methane, and nitrous oxide levels that raise radiative forcing and drive warming.
CO2 hit 407.8 ppm in 2018, 147% of pre-industrial levels.
Methane reached 259% of 1750 levels; rise exceeded 10-year average.
Nitrous oxide at 123% of 1750; increase above the past decade average.
Total radiative forcing up 43% since 1990; no slowdown observed.
The World Meteorological Organization (WMO) says the increase in CO2 was just above the average rise recorded over the last decade.
Levels of other warming gases, such as methane and nitrous oxide, have also surged by above average amounts.
Since 1990 there's been an increase of 43% in the warming effect on the climate of long lived greenhouse gases.
The WMO report looks at concentrations of warming gases in the atmosphere rather than just emissions.
The difference between the two is that emissions refer to the amount of gases that go up into the atmosphere from the use of fossil fuels, such as burning coal for coal-fired electricity generation and from deforestation.
Concentrations are what's left in the air after a complex series of interactions between the atmosphere, the oceans, the forests and the land. About a quarter of all carbon emissions are absorbed by the seas, and a similar amount by land and trees, while technologies like carbon capture are being explored to remove CO2.
Using data from monitoring stations in the Arctic and all over the world, researchers say that in 2018 concentrations of CO2 reached 407.8 parts per million (ppm), up from 405.5ppm a year previously.
This increase was above the average for the last 10 years and is 147% of the "pre-industrial" level in 1750.
The WMO also records concentrations of other warming gases, including methane and nitrous oxide, and some countries have reported declines in certain potent gases, as noted in US greenhouse gas controls reports, though global levels remain elevated. About 40% of the methane emitted into the air comes from natural sources, such as wetlands, with 60% from human activities, including cattle farming, rice cultivation and landfill dumps.
Methane is now at 259% of the pre-industrial level and the increase seen over the past year was higher than both the previous annual rate and the average over the past 10 years.
Nitrous oxide is emitted from natural and human sources, including from the oceans and from fertiliser-use in farming. According to the WMO, it is now at 123% of the levels that existed in 1750.
Last year's increase in concentrations of the gas, which can also harm the ozone layer, was bigger than the previous 12 months and higher than the average of the past decade.
What concerns scientists is the overall warming impact of all these increasing concentrations. Known as total radiative forcing, this effect has increased by 43% since 1990, and is not showing any indication of stopping.
There is no sign of a slowdown, let alone a decline, in greenhouse gases concentration in the atmosphere despite all the commitments under the Paris agreement on climate change and the ongoing global energy transition efforts," said WMO Secretary-General Petteri Taalas.
"We need to translate the commitments into action and increase the level of ambition for the sake of the future welfare of mankind," he added.
"It is worth recalling that the last time the Earth experienced a comparable concentration of CO2 was three to five million years ago. Back then, the temperature was 2-3C warmer, sea level was 10-20m higher than now," said Mr Taalas.
The UN Environment Programme will report shortly on the gap between what actions countries are taking to cut carbon, for example where Australia's emissions rose 2% recently, and what needs to be done to keep under the temperature targets agreed in the Paris climate pact.
Preliminary findings from this study, published during the UN Secretary General's special climate summit last September, indicated that emissions continued to rise during 2018, although global emissions flatlined in 2019 according to the IEA.
Both reports will help inform delegates from almost 200 countries who will meet in Madrid next week for COP25, following COP24 in Katowice the previous year, the annual round of international climate talks.
Related News
Related News
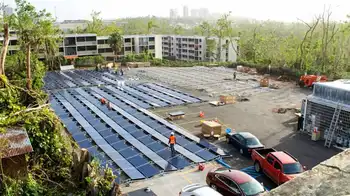
Canadian Solar and Tesla contribute to resilient electricity system for Puerto Rico school
SunCrate Solar Microgrid delivers resilient, plug-and-play renewable power to Puerto Rico schools, combining Canadian Solar…
View more
Washington AG Leads Legal Challenge Against Trump’s Energy Emergency
Washington-Led Lawsuit Against Energy Emergency challenges President Trump's executive order, citing state rights, environmental reviews,…
View more
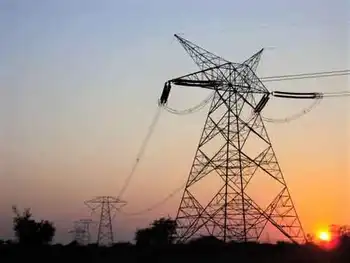
Massive power line will send Canadian hydropower to New York
Twin States Clean Energy Link connects New England to Hydro-Quebec via a 1,200 MW transmission…
View more

Maritime Link almost a reality, as first power cable reaches Nova Scotia
Maritime Link Subsea Cable enables HVDC grid interconnection across the Cabot Strait, linking Nova Scotia…
View more
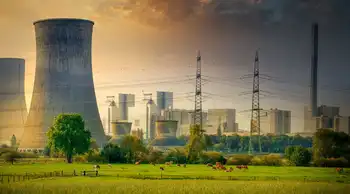
Europe Is Losing Nuclear Power Just When It Really Needs Energy
Europe's Nuclear Energy Policy shapes responses to the energy crisis, soaring gas prices, EU taxonomy…
View more

Why California's Climate Policies Are Causing Electricity Blackouts
California Rolling Blackouts expose grid reliability risks amid a heatwave, as CAISO curtails power while…
View more
Sign Up for Electricity Forum’s Newsletter
Stay informed with our FREE Newsletter — get the latest news, breakthrough technologies, and expert insights, delivered straight to your inbox.
Electricity Today T&D Magazine Subscribe for FREE

Stay informed with the latest T&D policies and technologies.
- Timely insights from industry experts
- Practical solutions T&D engineers
- Free access to every issue
