Protective Relay Training - Basic
Our customized live online or in‑person group training can be delivered to your staff at your location.

- Live Online
- 12 hours Instructor-led
- Group Training Available
Regular Price:
$699
Coupon Price:
$599
The Czech government recently delayed for two months a vote on a plan calling for the building of a new nuclear power plant, a spokeswoman said.
The spokeswoman said the delay will allow for a deeper discussion on the issue and gave no further details. But Deputy Industry and Trade Minister Martin Pecina, who prepared the 2004-2030 energy policy draft, told Reuters the government planned to hold a seminar and talks with anti-nuclear neighbour Austria.
The energy policy proposal sees building two new 600-megawatt nuclear reactors by about 2015, most likely by the state-controlled power producer CEZ. It also calls for expanding the mining areas of brown coal, a heavily polluting fuel for power plants.
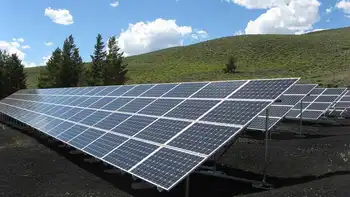
The Environment Ministry has opposed any new nuclear power sources beyond the six reactors already running at the Temelin and Dukovany plants. It also demanded maintaining current geographical limits on strip brown coal mining in the country's polluted northern regions and prefers power production from renewable resources.
CEZ is Europe's second largest power exporter after France's EdF, but many of its coal-burning power stations will close down around 2015 and will have to be replaced.
The Czechs share their southern border with the fiercely anti-nuclear Austria, which resisted the launch of the Temelin nuclear power plant. Another neighbour, Germany, has also pledged to phase out its existing nuclear stations.
Related News

Ottawa hands N.L. $5.2 billion for troubled Muskrat Falls hydro project
Muskrat Falls funding deal delivers federal relief to Newfoundland and Labrador: Justin Trudeau outlines loan…
View more
Georgia Power customers to see $21 reduction on June bills
Georgia Power June bill credit delivers PSC-approved savings, lower fuel rates, and COVID-19 relief for…
View more
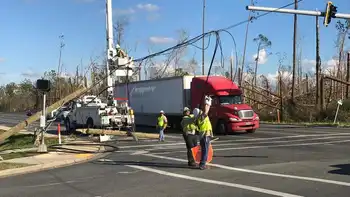
Crews have restored power to more than 32,000 Gulf Power customers
Gulf Power Hurricane Michael Response details rapid power restoration, grid rebuilding, and linemen support across…
View more
Texans to vote on funding to modernize electricity generation
Texas Proposition 7 Energy Fund will finance ERCOT grid reliability via loans and grants for…
View more
Quebec Hit by Widespread Power Outages Following Severe Windstorm
Quebec Windstorm 2025 disrupted Montreal and surrounding regions, triggering power outages, Hydro-Québec repairs, fallen trees,…
View more
Hydro once made up around half of Alberta's power capacity. Why does Alberta have so little now?
Alberta Hydropower Potential highlights renewable energy, dams, reservoirs, grid flexibility, contrasting wind and solar growth…
View more
Sign Up for Electricity Forum’s Newsletter
Stay informed with our FREE Newsletter — get the latest news, breakthrough technologies, and expert insights, delivered straight to your inbox.
Electricity Today T&D Magazine Subscribe for FREE

Stay informed with the latest T&D policies and technologies.
- Timely insights from industry experts
- Practical solutions T&D engineers
- Free access to every issue
