NFPA 70b Training - Electrical Maintenance
Our customized live online or in‑person group training can be delivered to your staff at your location.

- Live Online
- 12 hours Instructor-led
- Group Training Available
Regular Price:
$699
Coupon Price:
$599
WASHINGTON
—
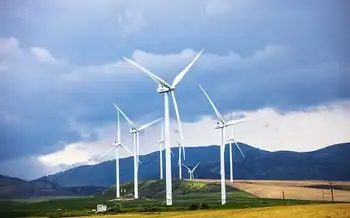
DOE Wind Energy Funding backs 13 R&D projects advancing offshore wind, distributed energy, and utility-scale turbines, including microgrids, battery storage, nacelle and blade testing, tall towers, and rural grid integration across the United States.
A Closer Look
DOE Wind Energy Funding is a $28M R&D effort in offshore, distributed, and utility-scale wind to lower cost and risk.
$28M for 13 R&D projects across U.S. wind sectors
Focus: offshore, distributed, and utility-scale wind integration
Rural microgrids, storage, and grid stability research funded
Nacelle and 85-120 m blade testing upgrades at major labs
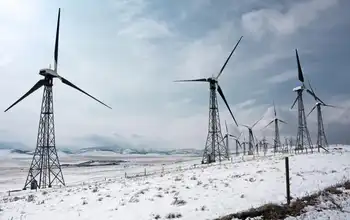
Tall tower tech to ease transport limits and cut costs
The U.S. Department of Energy announced that in order to advance wind energy in the U.S., 13 projects have been selected to receive $28 million. Project topics focus on technology development while covering distributed, offshore wind growth and utility-scale wind found on land.
The selections were announced by the DOE’s Assistant Secretary for the Office of Energy Efficiency and Renewable Energy, Daniel R. Simmons, at the American Wind Energy Association Offshore Windpower Conference in Boston, as New York's offshore project momentum grows nationwide.
Wind Project Awards
According to the DOE, four Wind Innovations for Rural Economic Development projects will receive a total of $6 million to go toward supporting rural utilities via facilitating research drawing on U.K. wind lessons for deployment that will allow wind projects to integrate with other distributed energy resources.
These endeavors include:
Bergey WindPower (Norman, Oklahoma) working on developing a standardized distributed wind/battery/generator micro-grid system for rural utilities;
Electric Power Research Institute (Palo Alto, California) working on developing modeling and operations for wind energy and battery storage technologies, as large-scale projects in New York progress, that can both help boost wind energy and facilitate rural grid stability;
Iowa State University (Ames, Iowa) working on optimization models and control algorithms to help rural utilities balance wind and other energy resources; and
The National Rural Electric Cooperative Association (Arlington, Virginia) providing the development of standardized wind engineering options to help rural-area adoption of wind.
Another six projects are to receive a total of $7 million to facilitate research and development in offshore wind, as New York site investigations advance, with these projects including:
Clemson University (North Charleston, South Carolina) improving offshore-scale wind turbine nacelle testing via a “hardware-in-the-loop capability enabling concurrent mechanical, electrical and controller testing on the 7.5-megawatt dynamometer at its Wind Turbine Drivetrain Testing Facility to accelerate 1 GW on the grid progress”; and
The Massachusetts Clean Energy Center (Boston) upgrading its Wind Technology Testing Center to facilitate structural testing of 85- to 120-meter-long (roughly 278- to 393-foot-long) blades, as BOEM lease requests expand, among other projects.
Additionally, two offshore wind technology demonstration projects will receive up to $10 million for developing initiatives connected to reducing wind energy risk and cost. One last project will also be granted $5 million for the development of tall tower technology that can help overcome restrictions associated with transportation.
“These projects will be instrumental in driving down technology costs and increasing consumer options for wind across the United States as part of our comprehensive energy portfolio,” said Simmons.
Related News
Related News

Warren Buffett-linked company to build $200M wind power farm in Alberta
Rattlesnake Ridge Wind Project delivers 117.6 MW in southeast Alberta for BHE Canada, a Berkshire…
View more
TransAlta Scraps Wind Farm as Alberta's Energy Future Blusters
Alberta Wind Energy Policy Changes highlight TransAlta's Riplinger cancellation amid UCP buffer zones for pristine…
View more

Here's what we know about the mistaken Pickering nuclear alert one week later
Pickering Nuclear Alert Error prompts Ontario investigation into the Alert Ready emergency alert system, Pelmorex…
View more
EDF and France reach deal on electricity prices-source
EDF Nuclear Power Price Deal sets a 70 euros/MWh reference price, adds consumer protection if…
View more
Wartsila to Power USA’s First Battery-Electric High-Speed Ferries
San Francisco Battery-Electric Ferries will deliver zero-emission, high-speed passenger service powered by Wartsila electric propulsion,…
View more

UK must start construction of large-scale storage or fail to meet net zero targets.
UK Hydrogen Storage Caverns enable long-duration, low-carbon electricity balancing, storing surplus wind and solar power…
View more
Sign Up for Electricity Forum’s Newsletter
Stay informed with our FREE Newsletter — get the latest news, breakthrough technologies, and expert insights, delivered straight to your inbox.
Electricity Today T&D Magazine Subscribe for FREE

Stay informed with the latest T&D policies and technologies.
- Timely insights from industry experts
- Practical solutions T&D engineers
- Free access to every issue

