Protective Relay Training - Basic
Our customized live online or in‑person group training can be delivered to your staff at your location.

- Live Online
- 12 hours Instructor-led
- Group Training Available
Regular Price:
$699
Coupon Price:
$599
VANCOUVER
—
Canada Electricity Decarbonization Costs indicate challenging greenhouse gas reductions across a fragmented grid, with wind, solar, nuclear, and natural gas tradeoffs, significant GDP impacts, and Net Zero targets constrained by intermittency and limited interties.
Essential Takeaways
Costs to cut power CO2 via wind, solar, gas, and nuclear, considering grid limits, intermittency, and GDP impacts.
Fragmented provincial grids with limited interties constrain trade
Wind and solar intermittency raises system balancing and reserve needs
Coal removal cuts 26-40 percent CO2; nuclear enables 75 percent plus
Annual costs $16.8-33.7B, roughly 1-2 percent of Canada GDP
Estimates exclude transmission, land, waste, and capacity market costs
Along with many western developed countries, Canada has pledged to reduce its greenhouse gas emissions by 40–45 percent by 2030 from 2005 emissions levels, and to achieve net-zero emissions by 2050.
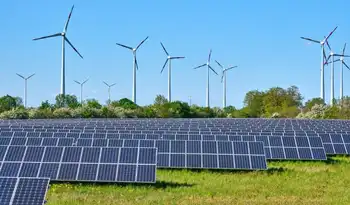
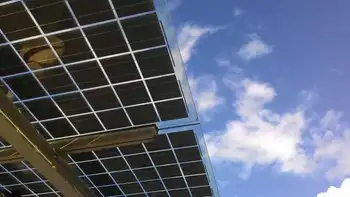
This is a huge challenge that, when considered on a global scale, will do little to stop climate change because emissions by developing countries are rising faster than emissions are being reduced in developed countries. Even so, the potential for achieving emissions reduction targets is extremely challenging as there are questions as to how and whether targets can be met and at what cost. Because electricity can be produced from any source of energy, including wind, solar, geothermal, tidal, and any combustible material, climate change policies have focused especially on nations’ electricity grids, and in Canada cleaning up electricity is viewed as critical to meeting climate pledges.
Canada’s electricity grid consists of ten separate provincial grids that are weakly connected by transmission interties to adjacent grids and, in some cases, to electricity systems in the United States. At times, these interties are helpful in addressing small imbalances between electricity supply and demand so as to prevent brownouts or even blackouts, and are a source of export revenue for provinces that have abundant hydroelectricity, such as British Columbia, Manitoba, and Quebec.
Due to generally low intertie capacities between provinces, electricity trade is generally a very small proportion of total generation, though electricity has been a national climate success in recent years. Essentially, provincial grids are stand alone, generating electricity to meet domestic demand (known as load) from the lowest cost local resources.
Because climate change policies have focused on electricity (viz., wind and solar energy, electric vehicles), and Canada will need more electricity to hit net-zero according to the IEA, this study employs information from the Alberta electricity system to provide an estimate of the possible costs of reducing national CO2 emissions related to power generation. The Alberta system serves as an excellent case study for examining the potential for eliminating fossil-fuel generation because of its large coal fleet, favourable solar irradiance, exceptional wind regimes, and potential for utilizing BC’s reservoirs for storage.
Using a model of the Alberta electricity system, we find that it is infeasible to rely solely on renewable sources of energy for 100 percent of power generation—the costs are prohibitive. Under perfect conditions, however, CO2 emissions from the Alberta grid can be reduced by 26 to 40 percent by eliminating coal and replacing it with renewable energy such as wind and solar, and gas, but by more than 75 percent if nuclear power is permitted. The associated costs are estimated to be some $1.4 billion per year to reduce emissions by at most 40 percent, or $1.9 billion annually to reduce emissions by 75 percent or more using nuclear power (an option not considered feasible at this time).
Based on cost estimates from Alberta, and Ontario’s experience with subsidies to renewable energy, and warnings that the switch from fossil fuels to electricity could cost about $1.4 trillion, the costs of relying on changes to electricity generation (essentially eliminating coal and replacing it with renewable energy sources and gas) to reduce national CO2 emissions by about 7.4 percent range from some $16.8 to $33.7 billion annually. This constitutes some 1–2 percent of Canada’s GDP.
The national estimates provided here are conservative, however. They are based on removing coal-fired power from power grids throughout Canada. We could not account for scenarios where the scale of intermittency turned out worse than indicated in our dataset—available wind and solar energy might be lower than indicated by the available data. To take this into account, a reserve market is required, but the costs of operating such a capacity market were not included in the estimates provided in this study. Also ignored are the costs associated with the value of land in other alternative uses, the need for added transmission lines, environmental and human health costs, and the life-cycle costs of using intermittent renewable sources of energy, including costs related to the disposal of hazardous wastes from solar panels and wind turbines.
Related News
Related News
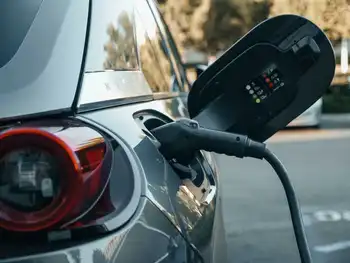
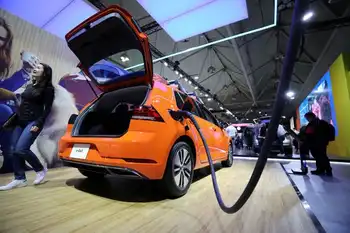
EV Boom Unexpectedly Benefits All Electricity Customers
Electric Vehicles Lower Electricity Rates by boosting demand, enabling fixed-cost recovery, and encouraging off-peak charging…
View more

Alectra is 'leading the charge' when it comes to electric vehicles
Alectra EV Leadership Award highlights Plug'n Drive and CEA recognition for AlectraDrive, GridExchange, smart charging,…
View more
25.5% Of US Electricity Coming From Renewable Energy
US Renewable Energy Growth drives the US electricity mix as wind, solar, and hydropower rise…
View more
The government's 2035 electric vehicle mandate is delusional
Canada 2035 Zero-Emission Vehicle Mandate sets EV sales targets, raising concerns over affordability, battery materials…
View more
Bus depot bid to be UK's largest electric vehicle charging hub
First Glasgow Electric Buses will transform the Caledonia depot with 160 charging points, zero-emission operations,…
View more

EV charging to solar panels: How connected tech is changing the homes we live in
Connected Home Energy Technologies integrate solar panels, smart meters, EV charging, battery storage, and IoT…
View more
Sign Up for Electricity Forum’s Newsletter
Stay informed with our FREE Newsletter — get the latest news, breakthrough technologies, and expert insights, delivered straight to your inbox.
Electricity Today T&D Magazine Subscribe for FREE

Stay informed with the latest T&D policies and technologies.
- Timely insights from industry experts
- Practical solutions T&D engineers
- Free access to every issue
