Protective Relay Training - Basic
Our customized live online or in‑person group training can be delivered to your staff at your location.

- Live Online
- 12 hours Instructor-led
- Group Training Available
Regular Price:
$699
Coupon Price:
$599
BOISE
—
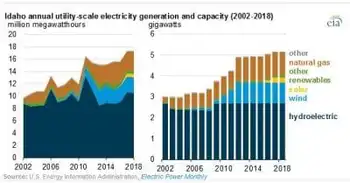
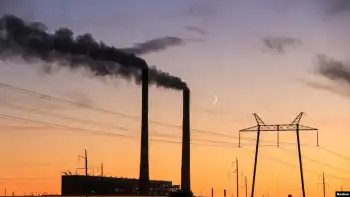
Idaho Renewable Energy 2018 saw over 80% in-state utility-scale power from hydropower, wind, solar, biomass, and geothermal, per EIA, with imports declining as Snake River Plain resources and Hells Canyon hydro lead.
The Core Facts
Idaho produced over 80% in-state power from renewables in 2018, led by hydropower, wind, solar, and biomass.
2018 total: 17.4M MWh; renewables: 14.2M MWh (over 80%).
Hydro dominant; ranked 7th in hydro gen; Hells Canyon complex.
Wind ~1/6 of generation; projects along Snake River Plain.
Solar 3% gen; 5% cap; biomass 3%; 18 MW geothermal; imports ~1/3 demand.
More than 80% of Idaho’s in-state utility-scale electricity generation came from renewable resources in 2018, behind only Vermont, according to recently released data from the U.S. Energy Information Administration’s Electric Power Monthly and broader trends showing that solar and wind reached about 10% of U.S. generation in the first half of 2018.
Idaho generated 17.4 million MWh of electricity in 2018, of which 14.2 million MWh came from renewable sources, while nationally January power generation jumped 9.3% year over year according to EIA. Idaho uses a variety of renewable resources to generate electricity:
Hydroelectricity. Idaho ranked seventh in the U.S. in electricity generation from hydropower in 2018. About half of Idaho’s electricity generating capacity is at hydroelectric power plants, and utility actions such as the Idaho Power settlement could influence future resource choices, and seven of the state’s 10 largest power plants (in terms of electricity generation) are hydroelectric facilities. The largest privately owned hydroelectric generating facility in the U.S. is a three-dam complex on the Snake River in Hells Canyon, the deepest river gorge in North America.
Wind. Nearly one-fifth of Idaho’s electricity generating capacity and one-sixth of its generation comes from wind turbines. Idaho has substantial wind energy potential, and nationally the EIA expects solar and wind to be larger sources this summer, although only a small percentage of the state's land area is well-suited for wind development. All of the state’s wind farms are located in the southern half of the state along the Snake River Plain.
Solar. Almost 5% of Idaho’s electricity generating capacity and 3% of its generation come from utility-scale solar facilities, and nationally over half of new capacity in 2023 will be solar according to projections. The state had no utility-scale solar generation as recently as 2015. Between 2016 and 2017, Idaho’s utility-scale capacity doubled and generation increased from 30,000 MWh to more than 450,000 MWh. Idaho’s small-scale solar capacity also doubled since 2017, generating 33,000 MWh in 2018.
Biomass. Biomass-fueled power plants account for about 2% of the state’s utility-scale electricity generating capacity and 3% of its generation, contributing to a broader U.S. shift where 40% of electricity came from non-fossil sources in 2021. Wood waste from the state’s forests is the primary fuel for these plants.
Geothermal. Idaho is one of seven states with utility-scale geothermal electricity generation. Idaho has one 18-MW geothermal facility, located near the state’s southern border with Utah.
EIA says Idaho requires significant electricity imports, totaling about one-third of demand, to meet its electricity needs. However, Idaho’s electricity imports have decreased over time, and Georgia's recent import levels illustrate how regional dynamics can vary. Almost all of these imports are from neighboring states, as electricity imports from Canada accounted for less than 0.1% of Idaho’s total electricity supply in 2017.
Related News
Related News
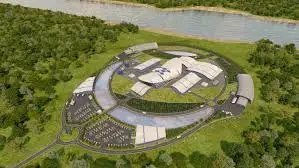
US NRC issues final safety evaluation for NuScale SMR
NuScale SMR Design Certification marks NRC Phase 6 FSER approval, validating small modular reactor safety…
View more

OPG, TVA Partner on New Nuclear Technology Development
OPG-TVA SMR Partnership advances advanced nuclear technology and small modular reactors for 24/7 carbon-free baseload…
View more
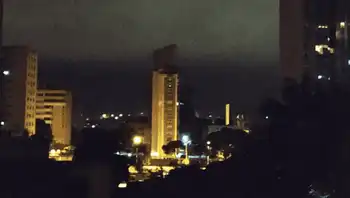
Venezuela: Electricity Recovery Continues as US Withdraws Diplomatic Staff
Venezuela Power Outage cripples the national grid after a massive blackout; alleged cyber attacks at…
View more
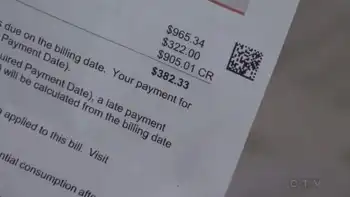
Ontario tables legislation to lower electricity rates
Ontario Clean Energy Adjustment lowers hydro bills by shifting global adjustment costs, cutting time-of-use rates,…
View more
Electricity Market Headed for a Reshuffle as Province Vows Overhaul
Alberta Electricity Market Overhaul will add renewables like wind and solar, curb price volatility tied…
View more
Ontario pitches support for electric bills
Ontario CEAP Program provides one-time electricity bill relief for residential consumers via local utilities, supports…
View more
Sign Up for Electricity Forum’s Newsletter
Stay informed with our FREE Newsletter — get the latest news, breakthrough technologies, and expert insights, delivered straight to your inbox.
Electricity Today T&D Magazine Subscribe for FREE

Stay informed with the latest T&D policies and technologies.
- Timely insights from industry experts
- Practical solutions T&D engineers
- Free access to every issue

