CSA Z462 Arc Flash Training – Electrical Safety Compliance Course
Our customized live online or in‑person group training can be delivered to your staff at your location.

- Live Online
- 6 hours Instructor-led
- Group Training Available
Regular Price:
$249
Coupon Price:
$199
Ontario 2013 electricity mix saw IESO report nuclear baseload dominance, rising hydro and wind, shrinking gas and coal phase-out, demand response and solar integration, plus higher Global Adjustment with wholesale price shifts, imports and exports.
The Important Points
IESO data shows nuclear baseload dominance, more hydro and wind, reduced gas and coal, demand, and higher power costs.
- Nuclear supplied about 60% of total generation.
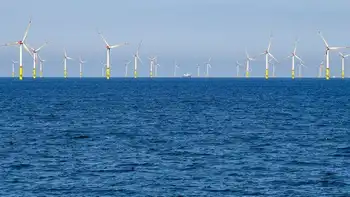
- Hydro rose to 23.4% and wind to 3.4% of output.
- Gas generation fell to 17.1 TWh as peaks eased.
- Coal dropped to 2.1% with southern plants closed.
Ontario's Independent Electricity System Operator IESO recently released 2013 statistics for electricity supply, demand, and price in the province.
"Ontario's electricity data for the past year reflects what we are seeing day-to-day on our Control Room floor - lower demands, increased local generation and an overall greater reliance on base supply," said Bruce Campbell, President and CEO of the Independent Electricity System Operator.
"Yet it is only a snapshot in time. Ontario's electricity system will continue to evolve over 2014 and beyond, as outlined in the IESO's 18-month outlook report, with the introduction of solar energy to the grid, demand response and wind generation developing critical mass as well as the nuclear refurbishment program."
Supply
Ontario's reliance on nuclear energy increased over the last year, as it continued to account for most of the province's baseload needs - roughly 60 percent of total production. Other baseload supply such as hydro and wind generation output also increased - to 23.4 percent and 3.4 percent respectively.
Gas generation output decreased by more than three percent to 17.1 TWh, a result in part of lower demand peaks throughout the year. Coal generation, which by the end of 2013 had ceased production in southern Ontario, generated only 2.1 percent or 3.2 TWh of total production.
Electricity imports from neighbouring jurisdictions were also slightly up to 4.9 TWh in 2013, while exports rose to 18.3 TWh, reflecting extra energy this summer in periods of lower demand.
Demand
Demand for electricity in Ontario remained largely unchanged over the year, and during heat events Ontario's electrical system can take the heat due to sufficient capacity, with overall consumption at 140.7 TWh. This figure represents a slight decrease from 2012, which was a leap year.
Local, or embedded generation, and demand management efforts have contributed to flattening demand for electricity from the provincial power grid.
Local, or embedded generation, and demand management efforts, including demand response programs, have contributed to flattening demand for electricity from the provincial power grid.
The IESO estimates that peak demand was reduced by an average of 1,200 MW during peak days last summer as a result of demand management efforts such the Global Adjustment Allocation, DR3, large consumers participating in the market also known as dispatchable load and time-of-use rates.
Mother Nature also triggered a number of unexpected demand reductions during 2013. On July 8, severe floods resulted in a demand drop of approximately 3,800 MW as thousands of customers lost electricity service across the GTA. This was the greatest loss of load since the 2003 blackout that affected most of the province. The recent ice storm resulted in a loss of an estimated 1,800 MW in demand during the early days of the outage, with continuous load losses over the remainder of the week.
Price
Total cost of power in 2013 was 8.55 cents per kilowatt-hour kWh, a figure highlighted in debates over Ontario green energy costs across the province, up from 7.37 cents in 2012. This cost includes the average weighted wholesale market price of 2.65 cents/kWh and the average Global Adjustment of 5.90 cents/kWh.*
The IESO is responsible for managing Ontario's bulk electricity power system and operating the wholesale market, and shares a positive power outlook with stakeholders. It provides a range of historical and real-time electricity data, such as hourly demand, generator output, and prices on its web site at www.ieso.ca.
*incorporates an estimate for the December 2013 Global Adjustment
Related News
Related News
"Energy war": Ukraine tries to protect electricity supply before winter
Ukraine Power Grid Resilience details preparations for winter blackouts, airstrike defense, decentralized generation, backup generators,…
View more

McMaster Training Next Gen Nuclear Professionals
McMaster University is expanding its nuclear training programs to prepare engineers, researchers, and medical specialists…
View more
Wind Denmark - summer's autumn weather provides extraordinarily low electricity prices
Western Denmark Negative Electricity Prices stem from wind energy oversupply, grid congestion, and limited interconnector…
View more

Old meters giving away free electricity to thousands of N.B. households
NB Power Smart Meters will replace aging analog meters, boosting billing accuracy, reducing leakage, and…
View more

Energy Vault Lands $110M From SoftBank’s Vision Fund for Gravity Storage
Energy Vault Gravity Storage uses crane-stacked concrete blocks to deliver long-duration, grid-scale renewable energy; a…
View more

EPA, New Taipei spar over power plant
Shenao Power Plant Controversy intensifies as the EPA, Taipower, and New Taipei officials clash over…
View more
Sign Up for Electricity Forum’s Newsletter
Stay informed with our FREE Newsletter — get the latest news, breakthrough technologies, and expert insights, delivered straight to your inbox.
Electricity Today T&D Magazine Subscribe for FREE

Stay informed with the latest T&D policies and technologies.
- Timely insights from industry experts
- Practical solutions T&D engineers
- Free access to every issue
