Measuring all those Wii devices

By Globe and Mail


NFPA 70b Training - Electrical Maintenance

Our customized live online or in‑person group training can be delivered to your staff at your location.

  • Live Online
  • 12 hours Instructor-led
  • Group Training Available
Regular Price:
$599
Coupon Price:
$499
Reserve Your Seat Today
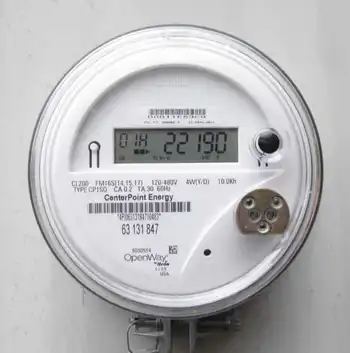
It was an experiment waiting to happen: a freezing cold cabin that had been left in winter shutdown mode for a month; a brand new "smart meter," a digital electricity gauge installed by the provincial power company; and a PlayStation 3 with some heavy lifting to do for a good cause.

My first thought was to isolate my PS3 on this little corner of the energy grid, charting its power usage as it crunched numbers for Stanford University's Folding(AT)Home project. That distributed computing program breaks up staggeringly complex calculations among thousands of computers and gaming consoles. You download the client onto your computer or PS3 and then leave it running for eight hours or more as the processors unravel folding proteins, which are key to understanding many deadly diseases and their potential cures.

(My motives, I will admit, were not completely scientific in this case: You are donating to Folding(AT)Home not just your device's time, but also the electricity it takes to power all that cogitating. And it's tax season; every bit counts with research, power conservation, and maybe, down the road, Revenue Canada.) The isolation idea didn't last long, mostly because the warm air emanating from the PS3, substantial as it was, could not heat the house on its own, and the baseboard heaters were fired up. Then a computer needed charging and the oven is electric. The experimental conditions were quickly compromised.

The smart meter went from one kilowatt-hour (kwh) at 3 p.m. — tracking 1,000 watts used over four days of watching an empty house — to just under 80 kwh by 9 a.m. the next day. To translate that into financial terms, consider that we pay between 5 and 15 cents for each kwh. That one night of consumption cost me about $5 (so well over $300 per month, if the juice continued to flow at that rate).

To figure out the PS3's consumption, I flipped through its manual to find that it can churn through up to 380 watts an hour. But like humans accessing 10 per cent of their brains, Sony's machine isn't using all of that current while it works. I couldn't find a consumption meter at any major retailers (funny, that), so I turned to research done by the Natural Resources Defense Council. The U.S. organization did a study in May of last year on all kinds of set-top boxes — TV receivers, DVD players and gaming consoles — and now distributes a handy guide with colourful charts.

They show console power usage climbing steadily over the years; each new generation is literally more powerful than the last. And the PS3 is right up there with mid-range PCs in terms of consumption, at around 200 watts. That means roughly five hours of folding proteins for each kwh, if the taxman ever recognizes these types of charitable efforts.

The Xbox 360 comes in at around 175 watts while playing a game or showing a movie.

The Wii, as its name suggests, uses considerably less — a stingy 20 watts, on average. But there is another thing to consider with consoles and all set-top boxes: leakage.

According to the NRDC, the Wii uses more power in idle mode than it does playing a game. All three consoles seep power even while turned off, from one watt-hour for the PS3 and 360 to almost nine watt-hours for the Wii. (The "WiiConnect24" feature downloads updates while you sleep, and it uses a pulsing-blue light, like the undercarriage of a souped-up Civic, to prove it).

With more than 20 million Wiis out there, all that electricity adds up, and not much of it comes from renewable resources yet. The best advice is to plug all of these boxes into power bars and then switch off the current when they are not in use. There are also rechargeable battery packs for their controllers, which will reduce the number of conventional batteries you need to buy and then dispose of.

This experiment does make one thing clear: The console makers need to do a lot more to help consumers cut back on their energy usage and its financial and environmental costs. The issue is barely mentioned in the documentation that ships with these devices. Stay tuned for more on that front in the near future.

Related News

Surging electricity demand is putting power systems under strain around the world

Global Electricity Demand Surge strains power markets, fuels price volatility, and boosts coal and gas generation as renewables lag, driving emissions, according to the IEA, with grids and clean energy investment crucial through 2024.


Key Points

A surge in power use that strained supply, raised prices, and drove power-sector CO2 emissions to record highs.

✅ 6% demand growth in 2021; largest absolute rise ever

✅ Coal up 9%; gas +2%; renewables +6% could not meet demand

✅ Prices doubled vs 2020; volatility hit EU, China, India


Global electricity demand surged above pre-pandemic levels in 2021, creating strains in major markets, pushing prices to unprecedented levels and driving the power sector’s emissions to a record high. Electricity is central to modern life and clean electricity is pivotal to energy transitions, but in the absence of faster structural change in the sector, rising demand over the next three years could result in additional market volatility and continued high emissions, according an IEA report released today.

Driven by the rapid economic rebound, and more extreme weather conditions than in 2020, including a colder than average winter, last year’s 6% rise in global electricity demand was the largest in percentage terms since 2010 when the world was recovering from the global financial crisis. In absolute terms, last year’s increase of over 1 500 terawatt-hours was the largest ever, according to the January 2022 edition of the IEA’s semi-annual Electricity Market Report.

The steep increase in demand outstripped the ability of sources of electricity supply to keep pace in some major markets, with shortages of natural gas and coal leading to volatile prices, demand destruction and negative effects on power generators, retailers and end users, notably in China, Europe and India. Around half of last year’s global growth in electricity demand took place in China, where demand grew by an estimated 10%, highlighting that Asia is set to use half of global electricity by 2025 according to the IEA. China and India suffered from power cuts at certain points in the second half of the year because of coal shortages.

“Sharp spikes in electricity prices in recent times have been causing hardship for many households and businesses around the world and risk becoming a driver of social and political tensions,” said IEA Executive Director Fatih Birol. “Policy makers should be taking action now to soften the impacts on the most vulnerable and to address the underlying causes. Higher investment in low-carbon energy technologies including renewables, energy efficiency and nuclear power – alongside an expansion of robust and smart electricity grids – can help us get out of today’s difficulties.”

The IEA’s price index for major wholesale electricity markets almost doubled compared with 2020 and was up 64% from the 2016-2020 average. In Europe, average wholesale electricity prices in the fourth quarter of 2021 were more than four times their 2015-2020 average, and wind and solar generated more electricity than gas in the EU during the year.  Besides Europe, there were also sharp price increases in Japan and India, while they were more moderate in the United States where gas supplies were less perturbed.

Electricity produced from renewable sources grew by 6% in 2021, but it was not enough to keep up with galloping demand. Coal-fired generation grew by 9%, with soaring electricity and coal use serving more than half of the increase in demand and reaching a new all-time peak as high natural gas prices led to gas-to-coal switching. Gas-fired generation grew by 2%, while nuclear increased by 3.5%, almost reaching its 2019 levels. In total, carbon dioxide (CO2) emissions from power generation rose by 7%, also reaching a record high, after having declined the two previous years.

“Emissions from electricity need to decline by 55% by 2030 to meet our Net Zero Emissions by 2050 Scenario, but in the absence of major policy action from governments, those emissions are set to remain around the same level for the next three years,” said Dr Birol. “Not only does this highlight how far off track we currently are from a pathway to net zero emissions by 2050, but it also underscores the massive changes needed for the electricity sector to fulfil its critical role in decarbonising the broader energy system.”

For 2022-2024, the report anticipates electricity demand growing 2.7% a year on average, although the Covid-19 pandemic and high energy prices bring some uncertainty to this outlook. Renewables are set to grow by 8% per year on average, and low-emissions sources are expected to serve more than 90% of net demand growth during this period. We expect nuclear-based generation to grow by 1% annually during the same period.

As a consequence of slowing electricity demand growth and significant renewables additions, fossil fuel-based generation is expected to stagnate in the coming years, and renewables are set to surpass coal by 2025 with coal-fired generation falling slightly as phase-outs and declining competitiveness in the United States and Europe are balanced by growth in markets like China, where electricity demand trends remain a puzzle in recent analyses, and India. Gas-fired generation is seen growing by around 1% a year.


Related News

View more

Competition in Electricity Has Been Good for Consumers and Good for the Environment

Electricity Market Competition drives lower wholesale prices, stable retail rates, better grid reliability, and faster emissions cuts as deregulation and renewables adoption pressure utilities, improve efficiency, and enhance consumer choice in power markets.


Key Points

Electricity market competition opens supply to rivals, lowering prices, improving reliability, and reducing emissions.

✅ Wholesale prices fell faster in competitive markets

✅ Retail rates rose less than in monopoly states

✅ Fewer outages, shorter durations, improved reliability


By Bernard L. Weinstein

Electricity used to be boring.  Public utilities that provided power to homes and businesses were regulated monopolies and, by law, guaranteed a fixed rate-of-return on their generation, transmission, and distribution assets. Prices per kilowatt-hour were set by utility commissions after lengthy testimony from power companies, wanting higher rates, and consumer groups, wanting lower rates.

About 25 years ago, the electricity landscape started to change as economists and others argued that competition could lead to lower prices and stronger grid reliability. Opponents of competition argued that consumers weren’t knowledgeable enough about power markets to make intelligent choices in a competitive pricing environment. Nonetheless, today 20 states have total or partial competition for electricity, allowing independent power generators to compete in wholesale markets and retail electric providers (REPs) to compete for end-use customers, a dynamic echoed by the Alberta electricity market across North America. (Transmission, in all states, remains a regulated natural monopoly).

A recent study by the non-partisan Pacific Research Institute (PRI) provides compelling evidence that competition in power markets has been a boon for consumers. Using data from the U.S. Energy Information Administration (EIA), PRI’s researchers found that wholesale electricity prices in competitive markets have been generally declining or flat, prompting discussions of free electricity business models, over the last five years. For example, compared to 2015, wholesale power prices in New England have dropped more than 44 percent, those in most Mid-Atlantic States have fallen nearly 42 percent, and in New York City they’ve declined by nearly 45 percent. Wholesale power costs have also declined in monopoly states, but at a considerably slower rate.

As for end-users, states that have competitive retail electricity markets have seen smaller price increases, as consumers can shop for electricity in Texas more cheaply than in monopoly states. Again, using EIA data, PRI found that in 14 competitive jurisdictions, retail prices essentially remained flat between 2008 and 2020. By contrast, retail prices jumped an average of 21 percent in monopoly states.  The ten states with the largest retail price increases were all monopoly-based frameworks. A 2017 report from the Retail Energy Supply Association found customers in states that still have monopoly utilities saw their average energy prices increase nearly 19 percent from 2008 to 2017 while prices fell 7 percent in competitive markets over the same period.

The PRI study also observed that competition has improved grid reliability, the recent power disruptions in California and Texas, alongside disruptions in coal and nuclear sectors across the U.S., notwithstanding. Looking at two common measures of grid resiliency, PRI’s analysis found that power interruptions were 10.4 percent lower in competitive states while the duration of outages was 6.5 percent lower.

Citing data from the EIA between 2008 and 2018, PRI reports that greenhouse gas emissions in competitive states declined on average 12.1 percent compared to 7.3 percent in monopoly states. This result is not surprising, and debates over whether Israeli power supply competition can bring cheaper electricity mirror these dynamics.  In a competitive wholesale market, independent power producers have an incentive to seek out lower-cost options, including subsidized renewables like wind and solar. By contrast, generators in monopoly markets have no such incentive as they can pass on higher costs to end-users. Perhaps the most telling case is in the monopoly state of Georgia where the cost to build nuclear Plant Vogtle has doubled from its original estimate of $14 billion 12 years ago. Overruns are estimated to cost Georgia ratepayers an average of $854, and there is no definite date for this facility to come on line. This type of mismanagement doesn’t occur in competitive markets.

Unfortunately, some critics are attempting to halt the momentum for electricity competition and have pointed to last winter’s “deep freeze” in Texas that left several million customers without power for up to a week. But this example is misplaced. Power outages in February were the result of unprecedented and severe weather conditions affecting electricity generation and fuel supply, and numerous proposals to improve Texas grid reliability have focused on weatherization and fuel resilience; the state simply did not have enough access to natural gas and wind generation to meet demand. Competitive power markets were not a factor.

The benefits of wholesale and retail competition in power markets are incontrovertible. Evidence shows that households and businesses in competitive states are paying less for electricity while grid reliability has improved. The facts also suggest that wholesale and retail competition can lead to faster reductions in greenhouse gas emissions. In short, competition in power markets is good for consumers and good for the environment.

Bernard L. Weinstein is emeritus professor of applied economics at the University of North Texas, former associate director of the Maguire Energy Institute at Southern Methodist University, and a fellow of Goodenough College, London. He wrote this for InsideSources.com.


Related News

View more

Electricity in Spain is 682.65% more expensive than the same day in 2020

Spain Electricity Prices surge to record highs as the wholesale market hits €339.84/MWh, driven by gas costs and CO2 permits, impacting PVPC regulated tariffs, free-market contracts, and household energy bills, OMIE data show.


Key Points

Rates in Spain's wholesale market that shape PVPC tariffs and free-market bills, moving with gas prices and CO2 costs.

✅ Record €339.84/MWh; peak 20:00-21:00; low 04:00-05:00 (OMIE).

✅ PVPC users and free-market contracts face higher bills.

✅ Drivers: high gas prices and rising CO2 emission rights.


Electricity in Spain's wholesale market will rise in price once more as European electricity prices continue to surge. Once again, it will set a historical record in Spain, reaching €339.84/MWh. With this figure, it is already the fifth time that the threshold of €300 has been exceeded.

This new high is a 6.32 per cent increase on today’s average price of €319.63/MWh, which is also a historic record, while Germany's power prices nearly doubled over the past year. Monday’s energy price will make it 682.65 per cent higher than the corresponding date in 2020, when the average was €43.42.

According to data published by the Iberian Energy Market Operator (OMIE), Monday’s maximum will be between the hours of 8pm and 9pm, reaching €375/MWh, a pattern echoed by markets where Electric Ireland price hikes reflect wholesale volatility. The cheapest will be from 4am to 5am, at €267.99.

The prices of the ‘pool’ have a direct effect on the regulated tariff  – PVPC – to which almost 11 million consumers in the country are connected, and serve as a reference for the other 17 million who have contracted their supply in the free market, where rolling back prices is proving difficult across Europe.

These spiraling prices in recent months, which have fueled EU energy inflation, are being blamed on high gas prices in the markets, and carbon dioxide (CO2) emission rights, both of which reached record highs this year.

According to an analysis by Facua-Consumidores en Acción, if the same rates were maintained for the rest of the month, the last invoice of the year would reach €134.45 for the average user. That would be 94.1 per cent above the €69.28 for December 2020, while U.S. residential electricity bills rose about 5% in 2022 after inflation adjustments.

The average user’s bill so far this year has increased by 15.1 per cent compared to 2018, as US electricity prices posted their largest jump in 41 years. Thus, compared to the €77.18 of three years ago, the average monthly bill now reaches €90.87 euros. However, the Government continues to insist that this year households will end up paying the same as in 2018.

As Ruben Sanchez, the general secretary of Facua commented, “The electricity bill for December would have to be negative for President Sanchez, and Minister Ribera, to fulfill their promise that this year consumers will pay the same as in 2018 once the CPI has been discounted”.


Related News

View more

Hydro once made up around half of Alberta's power capacity. Why does Alberta have so little now?

Alberta Hydropower Potential highlights renewable energy, dams, reservoirs, grid flexibility, contrasting wind and solar growth with limited investment, regulatory hurdles, river basin resources, and decarbonization pathways across Athabasca, Peace, and Slave River systems.


Key Points

It is the technical capacity for new hydro in Alberta's river basins to support a more reliable, lower carbon grid.

✅ 42,000 GWh per year developable hydro identified in studies.

✅ Major potential in Athabasca, Peace, and Slave River basins.

✅ Barriers include high capital costs, market design, water rights.


When you think about renewable energy sources on the Prairies, your mind may go to the wind farms in southern Alberta, or even the Travers Solar Project, southeast of Calgary.

Most of the conversation around renewable energy in the province is dominated by advancements in solar and wind power, amid Alberta's renewable energy surge that continues to attract attention. 

But what about Canada's main source of electricity — hydro power?

More than half of Canada's electricity is generated from hydro sources, with 632.2 terawatt-hours produced as of 2019. That makes it the fourth largest installed capacity of hydropower in the world. 

But in Alberta, it's a different story. 

Currently, hydro power contributes between three and five per cent of Alberta's energy mix, while fossil fuels make up about 89 per cent.

According to Canada's Energy Future report from the Canada Energy Regulator, by 2050 it will make up two per cent of the province's electricity generation shares.

So why is it that a province so rich in mountains and rivers has so little hydro power?


Hydro's history in Alberta
Hydro power didn't always make up such a small sliver of Alberta's electricity generation. Hydro installations began in the early 20th century as the province's population exploded. 

Grant Berg looks after engineering for hydro for TransAlta, Alberta's largest producer of hydro power with 17 facilities across the province.

"Our first plant was Horseshoe, which started in 1911 that we formed as Calgary Power," he said. 

"It was really in response to the City of Calgary growing and having some power needs."

Berg said in 1913, TransAlta's second installation, the Kananaskis Plant, started as Calgary continued to grow.

A historical photo of a hydro-electric dam in Kananaskis Alta. taken in 1914.
Hydro power plant in Kananaskis as seen in 1914. (Glenbow Archives)
Some bigger installations were built in the 1920s, including Ghost reservoir, but by mid-century population growth increased.

"Quite a large build out really, I think in response to the growth in Alberta following the war. So through the 1950s really quite a large build out of hydro from there."

By the 1950s, around half of the province's installed capacity was hydro power.

"Definitely Calgary power was all hydro until the 1950s," said Berg. 


Hydro potential in the province 
Despite the current low numbers in hydroelectricity, Alberta does have potential. 

According to a 2010 study, there is approximately 42,000 gigawatt-hours per year of remaining developable hydroelectric energy potential at identified sites. 

An average home in Alberta uses around 7,200 kilowatt-hours of electricity per year, meaning that the hydro potential could power 5.8 million homes each year. 

"This volume of energy could be sufficient to serve a significant amount of Alberta's load and therefore play a meaningful role in the decarbonization of the province's electric system," the Alberta Electric System Operator said in its 2022 Pathways to Net-Zero Emissions report.

Much of that potential lies in northern Alberta, in the Athabasca, Peace and Slave River basins.

The AESO report says that despite the large resource potential, Alberta's energy-only market framework has attracted limited investment in hydroelectric generation. 

Hydro power was once a big deal in Alberta, but investment in the industry has been in decline since the 1950s. Climate change reporter Christy Climenhaga explains why.
So why does Alberta leave out such a large resource potential on the path to net zero?

The government of Alberta responded to that question in a statement. 

"Hydro facilities, particularly large scale ones involving dams, are associated with high costs and logistical demands," said the Ministry of Affordability and Utilities. 

"Downstream water rights for other uses, such as irrigation, further complicate the development of hydro projects."

The ministry went on to say that wind and solar projects have increased far more rapidly because they can be developed at relatively lower cost and shorter timelines, and with fewer logistical demands.

"Sources from wind power and solar are increasingly more competitive," said Jean-Denis Charlebois, chief economist with the Canadian Energy Regulator. 


Hydro on the path to net zero
Hydro power is incredibly important to Canada's grid, and will remain so, despite growth in wind and solar power across the province.

Charlebois said that across Canada, the energy make-up will depend on the province. 

"Canadian provinces will generate electricity in very different ways from coast to coast. The major drivers are essentially geography," he said. 

Charlebois says that in British Columbia, Manitoba, Quebec and Newfoundland and Labrador, hydropower generation will continue to make up the majority of the grid.

"In Alberta and Saskatchewan, we see a fair bit of potential for wind and solar expansion in the region, which is not necessarily the case on Canada's coastlines," he said.

And although hydro is renewable, it does bring its adverse effects to the environment — land use changes, changes in flow patterns, fish populations and ecosystems, which will have to be continually monitored. 

"You want to be able to manage downstream effects; make sure that you're doing all the proper things for the environment," said Ryan Braden, director of mining and hydro at TransAlta.

Braden said hydro power still has a part to play in Alberta, even with its smaller contributions to the future grid. 

"It's one of those things that, you know, the wind doesn't blow or the sun doesn't shine, this is here. The way we manage it, we can really support that supply and demand," he said.


Related News

View more

Japanese utilities buy into vast offshore wind farm in UK

Japan Offshore Wind Investment signals Japanese utilities entering UK offshore wind, as J-Power and Kansai Electric buy into Innogy's Triton Knoll, leveraging North Sea expertise, 9.5MW turbines, and 15-year fixed-rate contracts.


Key Points

Japanese utilities buying UK offshore wind stakes to import expertise, as J-Power and Kansai join Innogy's Triton Knoll.

✅ $900M deal: J-Power 25%, Kansai Electric ~16% in Innogy unit

✅ Triton Knoll: 860MW, up to 90 9.5MW turbines, 15-year fixed PPA

✅ Goal: Transfer North Sea expertise to develop Japan offshore wind


Two of Japan's biggest power companies will buy around 40% of a German-owned developer of offshore wind farms in the U.K., seeking to learn from Britain's lead in this sector, as highlighted by a UK offshore wind milestone this week, and bring the know-how back home.

Tokyo-based Electric Power Development, better known as J-Power, will join Osaka regional utility Kansai Electric Power in investing in a unit of Germany's Innogy.

The deal, estimated to be worth around $900 million, will give J-Power a 25% stake and Kansai Electric a roughly 16% share. It will mark the first investment in an offshore wind project by Japanese power companies, as other markets shift strategies, with Poland backing wind over nuclear signaling broader momentum.

Innogy plans to start up the 860-megawatt Triton Knoll offshore wind project -- one of the biggest of its kind in the world -- in the North Sea in 2021. The vast installation will have up to 90 9.5MW turbines and sell its output to local utilities under a 15-year fixed-rate contract.

J-Power, which supplies mainly fossil-fuel-based electricity to Japanese regional utilities, will set up a subsidiary backed by the government-run Development Bank of Japan to participate in the Innogy project. Engineers will study firsthand construction and maintenance methods.

While land-based wind turbines are proliferating worldwide, offshore wind farms have progressed mainly in Europe, though U.S. offshore wind competitiveness is improving in key markets. Installed capacity totaled more than 18,000MW at the end of 2017, which at maximum capacity can produce as much power as 18 nuclear reactors.

Japan has hardly any offshore wind farms in commercial operation, and has little in the way of engineering know-how in this field or infrastructure for linking such installations to the land power grid, with a recent Japan grid blackout analysis underscoring these challenges. But there are plans for a total of 4,000MW of offshore wind power capacity, including projects under feasibility studies.

J-Power set up a renewable energy division in June to look for opportunities to expand into wind and geothermal energy in Japan, and efforts like a Japan hydrogen energy system are emerging to support decarbonization. Kansai Electric also seeks know-how for increasing its reliance on renewable energy, even as it hurries to restart idled nuclear reactors.

They are not the only Japanese investors is in this field. In Asia, trading house Marubeni will invest in a Taiwanese venture with plans for a 600MW offshore wind farm.


Related News

View more

COVID-19 pandemic zaps electricity usage in Ontario as people stay home

Ontario Electricity Demand 2020 shows a rare decline amid COVID-19, with higher residential peak load, lower commercial usage, hot-weather air conditioning, nuclear baseload constraints, and smart meter data shaping grid operations and forecasting.


Key Points

It refers to 2020 power use in Ontario: overall demand fell, while residential peaks rose and commercial loads dropped.

✅ Peak load shifted to homes; commercial usage declined.

✅ Hot summers raised peaks; overall annual demand still fell.

✅ Smart meters aid forecasting; grid must balance nuclear baseload.


Demand for electricity in Ontario last year fell to levels rarely seen in decades amid shifts in usage patterns caused by pandemic measures, with Ottawa’s electricity consumption dropping notably, new data show.

The decline came despite a hot summer that had people rushing to crank up the air conditioning at home, the province’s power management agency said, even as the government offered electricity relief to families and small businesses.

“We do have this very interesting shift in who’s using the energy,” said Chuck Farmer, senior director of power system planning with the Independent Electricity System Operator.

“Residential users are using more electricity at home than we thought they would and the commercial consumers are using less.”

The onset of the pandemic last March prompted stay-home orders, businesses to close, and a shuttering of live sports, entertainment and dining out. Social distancing and ongoing restrictions, even as the first wave ebbed and some measures eased, nevertheless persisted and kept many people home as summer took hold and morphed into winter, while the province prepared to extend disconnect moratoriums for residential customers.

System operator data show peak electricity demand rose during a hot summer spell to 24,446 megawatts _ the highest since 2013. Overall, however, Ontario electricity demand last year was the second lowest since 1988, the operator said.

In all, Ontario used 132.2 terawatt-hours of power in 2020, a decline of 2.9 per cent from 2019.

With more people at home during the lockdown, winter residential peak demand has climbed 13 per cent above pre-pandemic levels, even as Hydro One made no cut in peak rates for self-isolating customers, while summer peak usage was up 19 per cent.

“The peaks are getting higher than we would normally expect them to be and this was caused by residential customers _ they’re home when you wouldn’t expect them to be home,” Farmer said.

Matching supply and demand _ a key task of the system operator _ is critical to meeting peak usage and ensuring a stable grid, and the operator has contingency plans with some key staff locked down at work sites to maintain operations during COVID-19, because electricity cannot be stored easily. It is also difficult to quickly raise or lower the output from nuclear-powered generators, which account for the bulk of electricity in the province, as demand fluctuates.

READ MORE: Ontario government extends off-peak electricity rates to Feb. 22

Life patterns have long impacted overall usage. For example, demand used to typically climb around 10 p.m. each night as people tuned into national television newscasts. Livestreaming has flattened that bump, while more energy-efficient lighting led to a drop in provincial demand over the holiday season.

The pandemic has now prompted further intra-day shifts in usage. Fewer people are getting up in the morning and powering up at home before powering down and rushing off to work or school. The summer saw more use of air conditioners earlier than normal after-work patterns.

Weather has always been a key driver of demand for power, accounting for example for the record 27,005 megawatts of usage set on a brutally hot Aug. 1, 2006. Similarly, a mild winter and summer led to an overall power usage drop in 2017.

Still, the profound social changes prompted by the COVID-19 pandemic _ and whether some will be permanent _ have complicated demand forecasting.

“Work patterns used to be much more predictable,” the agency said. “The pandemic has now added another element of variability for electricity demand forecasting.”

Some employees sent home to work have returned to their offices and other workplaces, and many others are likely do so once the pandemic recedes. However, some larger companies have indicated that working from home will be long term.

“Companies like Facebook and Shopify have already stated their intention to make work from home a more permanent arrangement,” the operator said. “This is something our near-term forecasters would take into account when preparing for daily operation of the grid.”

Aggregated data from better smart meters, which show power usage throughout the day, is one method of improving forecasting accuracy, the operator said.


Related News

View more

Sign Up for Electricity Forum’s Newsletter

Stay informed with our FREE Newsletter — get the latest news, breakthrough technologies, and expert insights, delivered straight to your inbox.

Electricity Today T&D Magazine Subscribe for FREE

Stay informed with the latest T&D policies and technologies.
  • Timely insights from industry experts
  • Practical solutions T&D engineers
  • Free access to every issue

Download the 2025 Electrical Training Catalog

Explore 50+ live, expert-led electrical training courses –

  • Interactive
  • Flexible
  • CEU-cerified