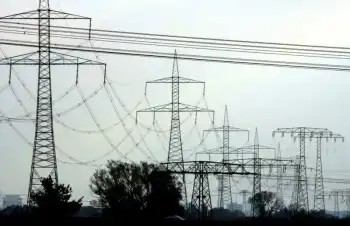
Fish boom prompts energy conglomerate to spend $14.5M to bury subsea cables


undersea cable

NFPA 70b Training - Electrical Maintenance

Our customized live online or in‑person group training can be delivered to your staff at your location.

  • Live Online
  • 12 hours Instructor-led
  • Group Training Available
Regular Price:
$599
Coupon Price:
$499
Reserve Your Seat Today

Maritime Link Cable Burial safeguards 200-kV subsea cables in the Cabot Strait as Emera and Nova Scotia Power trench lines to mitigate bottom trawling risks from a redfish boom, ensuring Muskrat Falls hydro delivery.


Key Points

Trenching Cabot Strait subsea power cables to prevent redfish-driven bottom trawling and ensure Muskrat Falls power.

✅ $14.492M spent trenching 59 km at 400 m depth

✅ Protects 200-kV, 170-km subsea interconnects from trawls

✅ Driven by Gulf redfish boom; DFO and UARB consultations


The parent company of Nova Scotia Power disclosed this week to the Utility and Review Board, amid Site C dam watchdog attention to major hydro projects, that it spent almost $14,492,000 this summer to bury its Maritime Links cables lying on the floor of the Cabot Strait between Newfoundland and Cape Breton.

It's a fish story no one saw coming, at least not Halifax-based energy conglomerate Emera.

The parent company of Nova Scotia Power disclosed this week to the Utility and Review Board that it spent almost $14,492,000 this summer to bury its Maritime Link cables lying on the floor of the Cabot Strait between Newfoundland and Cape Breton.

The cables were protected because an unprecedented explosion in the redfish population in the Gulf of St Lawrence is about to trigger a corresponding boom in bottom trawling in the area.

Also known as ocean perch, redfish were not on anyone's radar when the $1.5-billion Maritime Link was designed and built to carry Muskrat Falls hydroelectricity from Newfoundland to Nova Scotia.

The two 200-kilovolt electrical submarine cables spanning the Cabot Strait are the longest in North America, compared with projects like the New England Clean Power Link planned further south. They are each 170 kilometres long and weigh 5,500 tonnes.

Nova Scotia Power customers are paying for the Maritime Link in return for a minimum of 20 per cent of the electricity generated by Muskrat Falls over 35 years.

The electricity is supposed to start sending first electricity through the Maritime Link in mid-2020.

First time cost disclosed
In August, the company buried 59 kilometres of subsea cables one metre below the bottom at depths of 400 metres.

"These cables had not been previously trenched due to the absence of fishing activities at those depths when the cables were originally installed," spokesperson Jeff Myrick wrote in an email to CBC News in October.

Ratepayers will get the bill next year, as utilities also face risks like copper theft that can drive costs in the region. Until now, the company had declined to release costs relating to protecting the Maritime Link.

The bill will be presented to regulators, a process that has affected projects such as a Manitoba Hydro line to Minnesota, when the company applies to recover Maritime Link costs from Nova Scotia Power ratepayers in 2020.

Myrick said the company was acting after consultation with the Department of Fisheries and Oceans.

Unexpected consequences
After years of overfishing in the 1980s and early 1990s, redfish quotas were slashed and a moratorium imposed on some redfish.

Confusingly, there are actually two redfish species in the Gulf of St. Lawrence.

But very strong recent year classes, that have coincided with warming waters in the gulf, as utilities adapt to climate change considerations grow, have produced redfish in massive numbers.

After years of overfishing, the redfish population is now booming in the Gulf of St. Lawrence. (Submitted by Marine Institute)
There is now believed to be three-million tonnes of redfish in the Gulf of St Lawrence.

The Department of Fisheries and Oceans is expected to increase quotas in the coming years and the fishing industry is gearing up in a big way.

Earlier this month, Scotia Harvest announced it will begin construction of a new $14-million fish plant in Digby next spring in part to process increased redfish catches.


Related News

Related News

During this Pandemic, Save Money - How To Better Understand Your Electricity Bill

Commercial Electric Tariffs explain utility rate structures, peak demand charges, kWh vs kW pricing, time-of-use periods, voltage, delivery, capacity ratchets, and riders, guiding facility managers in tariff analysis for accurate energy savings.


Key Points

Commercial electric tariffs define utility pricing for energy, demand, delivery, time-of-use periods, riders, and ratchet charges.

✅ Separate kWh charges from kW peak demand fees.

✅ Verify time-of-use windows and demand interval length.

✅ Review riders, capacity ratchets, and minimum demand clauses.


Especially during these tough economic times, as major changes to electric bills are debated in some states, facility executives who don’t understand how their power is priced have been disappointed when their energy projects failed to produce expected dollar savings. Here’s how not to be one of them.

Your electric rate is spelled out in a document called a “tariff” that can be downloaded from your utility’s web page. A tariff should clearly spell out the costs for each component that is part of your rate, reflecting cost allocation practices in your region. Don’t be surprised to learn that it contains a bunch of them. Unlike residential electric rates, commercial electric bills are not based solely on the quantity of kilowatt-hours (kWh) consumed in a billing period (in the United States, that’s a month). Instead, different rates may apply to how your power is supplied, how it is delivered via electricity delivery charges, when it was consumed, its voltage, how fast it was used (in kW), and other factors.

If a tariff’s lingo and word structure are too opaque, spend some time with a utility account rep to translate it. Many state utility commissions also have customer advocates that may assist as they explore new utility rate designs that affect customers. Alternatively, for a fee, facility managers can privately chat with an energy consultant.

Common mistakes

Many facility managers try to estimate savings based on an averaged electric rate, i.e., annual electric spend divided by annual kWh. However, in markets where electricity demand is flat, such a number may obscure the fastest rising cost component: monthly peak demand charges, measured in dollars per kW (or kilo-volt-amperes, kVA).

This charge is like a monthly speeding ticket, based solely on the highest speed you drove during that time. In some areas, peak demand charges now account for 30 to 60 percent of a facility’s annual electric spend. When projecting energy cost savings, failing to separately account for kW peak demand and kWh consumption may result in erroneous results, and a lot of questions from the C-suite.

How peak demand charges are calculated varies among utilities. Some base it on the highest average speed of use across one hour in a month, while others may use the highest average speed during a 15- or 30-minute period. Others may average several of the highest speeds within a defined time period (for example, 8 a.m. to 6 p.m. on weekdays). It is whatever your tariff says it is.

Because some power-consuming (or producing) devices, including those tied to smart home electricity networks, vary in their operation or abilities, they may save money on a few — but not all — of those rate components. If an equipment vendor calculates savings from its product by using an average electric rate, take pause. Tell the vendor to return after the proposal has been redone using tariff-based numbers.

When a vendor is the only person calculating potential savings from using a product, there’s also a built-in conflict of interest: The person profiting from an equipment sale should not also be the one calculating its expected financial return. Before signing any energy project contracts, it’s essential that someone independent of the deal reviews projected savings. That person (typically an energy or engineering consultant) should be quite familiar with your facility’s electric tariff, including any special provisions, riders, discounts, etc., that may pertain. When this doesn’t happen, savings often don’t occur as planned. 

For example, some utilities add another form of demand charge, based on the highest kW in a year. It has various names: capacity, contract demand, or the generic term “ratchet charge.” Some utilities also have a minimum ratchet charge which may be based on a percent of a facility’s annual kW peak. It ensures collection of sufficient utility revenue to cover the cost of installed transmission and distribution even when a customer significantly cuts its peak demand.


Related News

View more

Australia's energy transition stalled by stubbornly high demand

Australia Renewable Energy Transition: solar capacity growth, net-zero goals, rising electricity demand, coal reliance, EV adoption, grid decarbonization, heat waves, air conditioning loads, and policy incentives shaping clean power, efficiency, and emissions reduction.


Key Points

Australia targets net-zero by 2050 by scaling renewables, curbing demand, and phasing down coal and gas.

✅ Solar capacity up 200% since 2018, yet coal remains dominant.

✅ Transport leads energy use; EV uptake lags global average.

✅ Heat waves boost AC load, stressing grids and emissions goals.


A more than 200% increase in installed solar power generation capacity since 2018 helped Australia rank sixth globally in terms of solar capacity last year and emerge as one of the world's fastest-growing major renewable energy producers, aligning with forecasts that renewables to surpass coal in global power generation by 2025.

However, to realise its goal of becoming a net-zero carbon emitter by 2050, Australia must reverse the trajectory of its energy use, which remains on a rising path, even as Asia set to use half of electricity underscores regional demand growth, in contrast with several peers that have curbed energy use in recent years.

Australia's total electricity consumption has grown nearly 8% over the past decade, amid a global power demand surge that has exceeded pre-pandemic levels, compared with contractions over the same period of more than 7% in France, Germany and Japan, and a 14% drop in the United Kingdom, data from Ember shows.

Sustained growth in Australia's electricity demand has in turn meant that power producers must continue to heavily rely on coal for electricity generation on top of recent additions in supply of renewable energy sources, with low-emissions generation growth expected to cover most new demand.

Australia has sharply boosted clean energy capacity in recent years, but remains heavily reliant on coal & natural gas for electricity generation
To accomplish emissions reduction targets on time, Australia's energy use must decline while clean energy supplies climb further, as that would give power producers the scope to shut high-polluting fossil-powered energy generation systems ahead of the 2050 deadline.

DEMAND DRIVERS
Reducing overall electricity and energy use is a major challenge in all countries, where China's electricity appetite highlights shifting consumption patterns, but will be especially tough in Australia which is a relative laggard in terms of the electrification of transport systems and is prone to sustained heat waves that trigger heavy use of air conditioners.

The transport sector uses more energy than any other part of the Australian economy, including industry, and accounted for roughly 40% of total final energy use as of 2020, according to the International Energy Agency (IEA.)

Transport energy demand has also expanded more quickly than other sectors, growing by over 5% from 2010 to 2020 compared to industry's 1.3% growth over the same period.

Transport is Australia's main energy use sector, and oil products are the main source of energy type
To reduce energy use, and cut the country's fuel import bill which topped AUD $65 billion in 2022 alone, according to the Australian Bureau of Statistics, the Australian government is keen to electrify car fleets and is offering large incentives for electric vehicle purchases.

Even so, electric vehicles accounted for only 5.1% of total Australian car sales in 2022, according to the International Energy Agency (IEA).

That compares to 13% in New Zealand, 21% in the European Union, and a global average of 14%.

More incentives for EV purchases are expected, but any rapid adoption of EVs would only serve to increase overall electricity demand, and with surging electricity demand already straining power systems worldwide, place further pressure on power producers to increase electricity supplies.

Heating and cooling for homes and businesses is another major energy demand driver in Australia, and accounts for roughly 40% of total electricity use in the country.

Australia is exposed to harsh weather conditions, especially heat waves which are expected to increase in frequency, intensity and duration over the coming decades due to climate change, according to the New South Wales government.

To cope, Australians are expected to resort to increased use of air conditioners during the hottest times of the year, and with reduced power reserves flagged by the market operator, adding yet more strain to electricity systems.


Related News

View more

Energy-insecure households in the U.S. pay 27% more for electricity than others

Community Solar for Low-Income Homes expands energy equity by delivering renewable energy access, predictable bill savings, and tax credit benefits to renters and energy-insecure households, accelerating distributed generation and storage adoption nationwide.


Key Points

A program model enabling renters and LMI households to subscribe to off-site solar and save on utility bills.

✅ Earn bill credits from shared solar generation.

✅ Expands access for renters and LMI subscribers.

✅ Often paired with storage and IRA tax credit adders.


On a square-foot basis, the issue of inequality is made worse by higher costs for energy usage in the nation. Efforts like community solar programs such as Maryland community solar are underway to boost low-income participation in the cost benefits of renewable energy.

The Energy Information Administration (EIA) shows that households that are considered energy insecure, or those that have the inability to adequately meet basic household energy costs, are paying more for electricity than their wealthier counterparts. 

On average in the United States in 2020, households were billed about $1.04 per square foot for all energy sources. For homes that did not report energy insecurity, that average was $0.98 per square foot, while homes with energy insecurity issues paid an average of $1.24 per square foot for energy. This means that U.S. residents that need the most support on their energy bills are stuck with costs 27% higher than their neighbors on square-foot-basis.

EIA said energy-insecure households have reduced or forgone basic necessities to pay energy bills, kept their houses at unsafe temperatures because of energy cost concerns, or been unable to repair heating or cooling equipment because of cost.

In 2020, households with income less than $10,000 a year were billed an average of $1.31 per square foot for energy, while households making $100,000 or more were billed an average of $0.96 per square foot, said EIA. Renters paid considerably more ($1.28 per square foot) than owners ($0.98 per square foot). There were also considerable differences between regions, with New England solar growth sparking grid upgrade debates, ethnic groups and races, and insulation levels, as seen below.

The energy transition toward renewables like solar has offered price stability, amid record solar and storage growth nationwide, but thus far energy-insecure communities have relatively been left behind. A recent Berkeley Lab report, Residential Solar-Adopter Income and Demographic Trends, indicates that even though the rate of solar adoption among low-income residents is increasing (from 5% in 2010 to 11% in 2021), that segment of energy consumers remains under-represented among solar adopters, relative to its share of the population.


Community solar efforts

As such, the United States is targeting communities most impacted by energy costs that have not benefitted from the transition, highlighting “Energy Communities” that are eligible for an additional 10% tax credit through funds made possible by the Inflation Reduction Act.

Additionally, a push for community solar development is taking place nationwide to extend access to affordable solar energy to renters and other residents that aren’t able to leverage finances to invest in predictable, low-cost residential solar systems. The Biden Administration set a goal this year to sign up 5 million community solar households, achieving $1 billion in bill savings by 2025. The community solar model only represents about 8% of the total distributed solar capacity in the nation. This target would entail a jump from 3 GW installed capacity to 20 GW by the target year. The Department of Energy estimates community solar subscribers save an average of 20% on their bills.

California this year passed AB 2316, the Community Renewable Energy Act takes aim at four acute problems in the state’s power market: reliability amid rising outage risks, rates, climate and equity. The law creates a community renewable energy program, including community solar-plus-storage, supported by cheaper batteries, to overcome access barriers for nearly half of Californians who rent or have low incomes. Community solar typically involves customers subscribing to an off-site solar facility, receiving a utility bill credit for the power it generates.

“Community renewable energy is a proven powerful tool to help close California’s clean energy gap, bringing much needed relief to millions struggling with high housing costs and utility debt,” said Alexis Sutterman, energy equity program manager at the California Environmental Justice Alliance.

The program has energy equity baked into its structure, working to make sure Californians of all income levels participate in the benefits of the energy transition. Not only does it open solar access to renters, the law ensures that at least 51% of subscribers are low-income customers, which is expected to make projects eligible for a 10% tax credit adder under the IRA.

“The money’s on the table now,” said Jeff Cramer, president and chief executive of the Coalition for Community Solar Access. “While there are groups pushing for solar access for all, and states with strong legislation, there are other pockets of interest in surprising places in the United States. For example, Louisiana has no policy for community solar or support for low-income residents going solar but the city of New Orleans has its own utility commission with a community solar program. In Nebraska, forward-looking co-operatives have created community solar projects.

Community solar markets are active in 22 states, with more expected to come online in the future as states pursue 100% clean energy targets across the country. However, the market is expected to require strong community outreach efforts to foster trust and gain subscribers.

“There is a distrust of community solar initially in LMI communities as many have been burned before by retail energy false promises,” said Eric LaMora, executive director, community solar, Nautilus Solar on a panel at the Solar Energy Industries Association Finance, Tax, and Buyers seminar. “People are suspicious but there really are no hooks with community solar.”

LMI residents are leery to provide tax records or much documents at all in order to sign up for community solar, LaMora said. “We were surprised to see less of a default rate with LMI residents. We attribute this to the fact that they see significant savings on their electric bill, making it easier to pay each month,” he said.


Related News

View more

Groups clash over NH hydropower project

Northern Pass Hydropower Project Rehearing faces review by New Hampshire's Site Evaluation Committee as Eversource seeks approval for a 192-mile transmission line, citing energy cost relief, while Massachusetts eyes Central Maine Power as an alternative.


Key Points

A review of Eversource's halted NH transmission plan, weighing impacts, costs, and alternatives.

✅ SEC denied project, Eversource seeks rehearing

✅ 192-mile line to bring Canadian hydropower to NE

✅ Alternative bids include Central Maine Power corridor


Groups supporting and opposing the Northern Pass hydropower project in New Hampshire filed statements Friday in advance of a state committee’s meeting next week on whether it should rehear the project.

The Site Evaluation Committee rejected the transmission proposal last month over concerns about potential negative impacts. It is scheduled to deliberate Monday on Eversource’s request for a rehearing.

The $1.6 billion project would deliver hydropower from Canada, including Hydro-Quebec exports, to customers in southern New England through a 192-mile transmission line in New Hampshire.

If the Northern Pass project fails to ultimately win New Hampshire approval, the Massachusetts Department of Energy Resources has announced it will begin negotiating with a team led by Central Maine Power Co. for a $950 million project through a 145-mile Maine transmission line as an alternative.

Separately, construction later began on the disputed $1 billion electricity corridor despite ongoing legal and political challenges.

The Business and Industry Association voted last month to endorse the project after remaining neutral on it since it was first proposed in 2010. A letter sent to the committee Friday urges it to resume deliberations. The association said it is concerned about the severe impact the committee’s decision could have on New Hampshire’s economic future, even as Connecticut overhauls electricity market structure across New England.

“The BIA believes this decision was premature and puts New Hampshire’s economy at risk,” organization President Jim Roche wrote. “New Hampshire’s electrical energy prices are consistently 50-60 percent higher than the national average. This has forced employers to explore options outside New Hampshire and new England to obtain lower electricity prices. Businesses from outside New Hampshire and others now here are reversing plans to grow in New Hampshire due to the Site Evaluation Committee’s decision.”

The International Brotherhood of Electrical Workers and the Coos County Business and Employers Group also filed a statement in support of rehearing the project.

The Society to Protect New Hampshire Forests, which is opposed to the project, said Eversource’s request is premature because the committee hasn’t issued a final written decision yet. It also said Eversource hasn’t proven committee members “made an unlawful or unreasonable decision or mistakenly overlooked matters it should have considered.”

As part of its request for reconsideration, Eversource said it is offering up to $300 million in reductions to low-income and business customers in the state.

It also is offering to allocate $95 million from a previously announced $200 million community fund — $25 million to compensate for declining property values, $25 million for economic development and $25 million to promote tourism in affected areas. Another $20 million would fund energy efficiency programs.


Related News

View more

Electrifying Manitoba: How hydro power 'absolutely revolutionized' the province

Manitoba Electrification History charts arc lights, hydroelectric dams, Winnipeg utilities, transmission lines, rural electrification, and Manitoba Hydro to today's wind, solar, and EV transition across the provincial power grid, driving modernization and reliability.


Key Points

Manitoba's power evolution from arc lights to hydro and rural electrification, advancing wind and solar on a modern grid.

✅ 1873 Winnipeg arc light predates Edison and Bell.

✅ 1919 Act built transmission lines, rural electrification.

✅ Hydroelectric dams reshaped lands and affected First Nations.


The first electric light in Manitoba was turned on in Winnipeg in 1873, but it was a century ago this year that the switch was flipped on a decision that would bring power to the fingertips of people across the province.

On March 12, 1873, Robert Davis — who owned the Davis House hotel on Main Street, about a block from Portage Avenue — used an electric arc light to illuminate the front of his building, according to A History of Electric Power in Manitoba, published by Manitoba Hydro.

That type of light used an an inert gas in a glass container to create an electric arc between two metal electrodes.

"The lamp in front of the Davis Hotel is quite an institution," a Manitoba Free Press report from the day said. "It looks well and guides the weary traveller to a haven of rest, billiards and hot drinks."

A ladder crew from the Winnipeg Electric Street Railway Company working on an electric trolley line in 1905. (I.F. Allen/Manitoba Hydro archives)

The event took place six years before Thomas Edison's first incandescent lamp was invented and three years before the first complete sentence was spoken over the telephone by Alexander Graham Bell.

"Electrification probably had a bigger influence on the lives of Manitobans than virtually anything else," said Gordon Goldsborough, head researcher with the Manitoba Historical Society.

"It's one of the most significant changes in the lives of Manitobans ever, because basically it transformed so many aspects of their lives. It wasn't just one thing — it touched pretty much every aspect of life."


Winnipeg gets its 1st street lamps

In the pioneer days of lighting and street railway transportation in Winnipeg, multiple companies formed in an effort to take advantage of the new utility: Winnipeg Gas Company, Winnipeg General Power Company, Manitoba Electric and Gas Light Company, and The North West Electric Light and Power Company.

In October 1882, the first four street lamps, using electric arc lights, were turned on along Main Street from Broadway to the CPR crossing over the Assiniboine River.

They were installed privately by P.V. Carroll, who came from New York to establish the Manitoba Electric Light & Power Company and try to win a contract for illuminating the rest of the city's streets.

He didn't get it. Newspaper reports from the time noted many outages and other problems and general disappointment in the quality of the light.

Instead, the North West Electric Light and Power Company won that contract and in June 1883 it lit up the streets.

Workers erect a wooden hydro pole beside the Belmont Hotel in 1936. Belmont is a small community southeast of Brandon. (Manitoba Hydro archives)

Over the years, other companies would bring power to the city as it became more reliable, including the Winnipeg Electric Street Railway Company (WERCo), which built the streetcar system and sold electric heat, light and power.

But it was the Brandon Electric Light Company that first tapped into a new source of power — hydro. In 1900, a dam was built across the Minnedosa River (now known as the Little Saskatchewan River) in western Manitoba, and the province's first hydroelectric generating station was created.

The first transmission line was also built, connecting the station with Brandon.

By 1906, WERCo had taken over the Winnipeg General Power Company and the Manitoba Electric and Gas Light Company, and changed its name to the Winnipeg Electric Railway Company. Later, it became the Winnipeg Electric Company, or WECo.

It also took a cue from Brandon, building a hydroelectric plant to provide more power. The Pinawa dam site operated until 1951 and is now a provincial park.

The Minnedosa River plant was the first hydroelectric generating station in Manitoba. (Manitoba Hydro archives)

The City of Winnipeg Hydroelectric System was also formed in 1906 as a public utility to combat the growing power monopoly held by WECo, and to get cheaper power. The city had been buying its supply from the private company "and the City of Winnipeg didn't quite like that price," said Bruce Owen, spokesman for Manitoba Hydro.

So the city funded and built its own dam and generating station site on the Winnipeg River in Pointe du Bois — about 125 kilometres northeast of Winnipeg — which is still in operation today.

"All of a sudden, not only did we have street lights … businesses had lights, power was supplied to homes, people no longer had to cook on wood stoves or walk around with kerosene lanterns. This city took off," said Owen.

"It helped industry grow in the city of Winnipeg. Within a few short years, a second plant had to be built, at Slave Falls."


Lighting up rural Manitoba

While the province's two biggest cities enjoyed the luxury of electricity and the conveniences it brought, the patchwork of power suppliers had also created a jumble of contracts with differing rates and terms, spurring periodic calls for a western Canadian electricity grid to improve coordination.

Meanwhile, most of rural Manitoba remained in the dark.

The Pinawa Dam was built by the Winnipeg Electric Street Railway Company in 1906 and operated until 1951. (Manitoba Hydro archives)

The Pinawa Dam site now, looking like some old Roman ruins. (Darren Bernhardt/CBC)

That began to change in 1919 when the Manitoba government passed the Electric Power Transmission Act, with the aim of supplying rural Manitoba with electrical power. The act enabled the construction of transmission lines to carry electricity from the Winnipeg River generating stations to communities all over southern Manitoba.

It also created the Manitoba Power Commission, predecessor to today's Manitoba Hydro, to purchase power from the City of Winnipeg — and later WECo — to supply to those other communities.

The first transmission line, a 97-kilometre link between Winnipeg and Portage la Prairie, opened in late 1919, and modern interprovincial projects like Manitoba-Saskatchewan power line funding continue that legacy today. The power came from Pointe du Bois to a Winnipeg converter station that still stands at the corner of Stafford Street and Scotland Avenue, then went on to Portage la Prairie.

"That's the remarkable thing that started in 1919," said Goldsborough.

Every year after that, the list of towns connected to the power grid became longer "and gradually, over the early 20th century, the province became electrified," Goldsborough said.

"You'd see these maps that would spider out across the province showing the [lines] that connected each of these communities — a precursor to ideas like macrogrids — to each other, and it was really quite remarkable."

By 1928, 33 towns were connected to the Manitoba Power Commission grid. That rose to 44 by 1930 and 140 by 1939, according to the Manitoba Historical Society.


Power on the farm

Still, one group who could greatly use electricity for their operations — farmers — were still using lanterns, steam and coal for light, heat and power.

"The power that came to the [nearest] town didn't extend to them," said Goldsborough.

It was during the Second World War, as manual labour was hard to come by on farms, that the Manitoba Power Commission recognized the gap in its grid.

It met with farmers to explain the benefits electricity could bring and surveyed their interest. When the war ended in 1945, the farm electrification process got underway.

Employees, their spouses, and children pose for a photo outside of Great Falls generating station in 1923. (Manitoba Hydro archives)

Farmers were taught wiring techniques and about the use of motors for farm equipment, as well as about electric appliances and other devices to ease the burden of domestic life.

"The electrification of the 1940s and '50s absolutely revolutionized rural life," said Goldsborough.

"Farmers had to provide water for all those animals and in a lot of cases [prior to electrification] they would just use a hand pump, or sometimes they'd have a windmill. But these were devices that weren't especially reliable and they weren't high capacity."

Electric motors changed everything, from pumping water to handling grain, while electric heat provided comfort to both people and animals.

Workers build a hydro transmission line tower in an undated photo from Manitoba Hydro. (Manitoba Hydro archives)

"Now you could have heat lamps for your baby chickens. They would lose a lot of chickens normally, because they would simply be too cold," Goldsborough said.

Keeping things warm was important, but so too was refrigeration. In addition to being able to store meat in summer, it was "something to prolong the life of dairy products, eggs, anything," said Manitoba Hydro's Owen.

"It's all the things we take for granted — a flick of a switch to turn the lights on instead of walking around with a lantern, being able to have maybe a bit longer day to do routine work because you have light."

Agriculture was the backbone of the province but it was limited without electricity, said Owen.

Connecting it to the grid "brought it into the modern age and truly kick-started it to make it a viable part of our economy," he said. "And we still see that today."

In 1954, when the farm electrification program ended, Manitoba was the most wired of the western provinces, with 75 per cent of farms and 100,000 customers connected.

The success of the farm electrification program, combined with the post-war boom, brought new challenges, as the existing power generation could not support the new demand.

The three largest players — City Hydro, WECo and the Manitoba Power Commission, along with the provincial government  — created the Manitoba Hydro-Electric Board in 1949 to co-ordinate generation and distribution of power.

A float in a Second World War victory parade represents a hydroelectric dam and the electricity it generates to power cities. (Manitoba Hydro archives)

More hydroelectric generating stations were built and more reorganizations took place. WECo was absorbed by the board and its assets split into separate companies — Greater Winnipeg Gas and Greater Winnipeg Transit.

Its electricity distribution properties were sold to City Hydro, which became the sole distributor in central Winnipeg. The Manitoba Power Commission became sole distributor of electricity in the suburbs and the rest of Manitoba.


Impacts on First Nations

Even as the lives of many people in the province were made easier by the supply of electricity, many others suffered from negative impacts in the rush of progress.

Many First Nations were displaced by hydro dams, which flooded their ancestral lands and destroyed their traditional ways of life.

"And we hear stories about the potential abuses that occurred," said Goldsborough. "So you know, there are there pluses but there are definitely minuses."

In the late 1950s, the Manitoba Power Commission continued to grow and expand its reach, this time moving into the north by buying up private utilities in The Pas and Cranberry Portage.

In 1961, the provincial government merged the commission with the Manitoba Hydro-Electric Board to create Manitoba Hydro.

In 1973, 100 years after the first light went on at that Main Street hotel, the last of the independent power utilities in the province — the Northern Manitoba Power Company Ltd. — was taken over by Hydro.

Winnipeg Hydro, previously called City Hydro, joined the fold in 2002.

Today, Manitoba Hydro operates 15 generating stations and serves 580,262 electric power customers in the province, as well as 281,990 natural gas customers.


New era

And now, as happened in 1919, a new era in electricity distribution is emerging as alternative sources of power — wind and solar — grow in popularity, and as communities like Fort Frances explore integrated microgrids for resilience.

"There's a bit of a clean energy shift happening," said Owen, adding use of biomass energy — energy production from plant or animal material — is also expanding.

"And there's a technological change going on and that's the electrification of vehicles. There are only really several hundred [electric vehicles] in Manitoba on the streets right now. But we know at some point, with affordability and reliability, there'll be a switch over and the gas-powered internal combustion engine will start to disappear."

'We're just a little behind here': Manitoba electric vehicle owners call for more charging stations

That means electrical utilities around the world are re-examining their capabilities, as climate change increasingly stresses grids, said Owen.

"It's coming [and we need to know], are we in a position to meet it? What will be the demands on the system on a path to a net-zero grid by 2050 nationwide?" he said.

"It may not come in my lifetime, but it is coming."


Related News

View more

LOC Renewables Delivers First MWS Services To China's Offshore Wind Market

Pinghai Bay Offshore Wind Farm MWS advances marine warranty survey best practices, risk management, and international standards in Fujian, with Haixia Goldenbridge Insurance and reinsurer-aligned audits supporting safer offshore wind construction and logistics.


Key Points

An MWS program ensuring Pinghai Bay Phase 2 meets standards via audits, risk controls, and vetted procedures.

✅ First MWS delivered in China's offshore wind market

✅ Audits, risk consultancy, and reinsurer-aligned standards

✅ Supports 250MW Phase 2 at Pinghai Bay, Fujian


LOC Renewables has announced it is to carry out marine warranty survey (MWS) services for the second phase of the Pinghai Bay Offshore Wind Farm near Putian, Fujian province, China, on behalf of Haixia Goldenbridge Insurance Co., Ltd. The agreement represents the first time MWS services have been delivered to the Chinese offshore wind market.

China’s installed offshore capacity jumped more than 60% in 2017, and its growing offshore market is aiming for a total grid-connected capacity of 5GW by 2020, as the sector globally advances toward a $1 trillion industry over the coming decades. Much of this future offshore development is slated to take place in Jiangsu, Zhejiang, Guangdong and Fujian provinces. As developers becoming increasingly aware of the need for stringent risk management and value that internationally accepted standards can bring to projects, Pinghai Bay will be the first Chinese offshore wind farm to employ MWS to ensure it meets the highest technical standards and minimise project risk. The agreement will see LOC Renewables carry out audit and risk consultancy services for the project from March until the end of 2018.

#google#

In recent years, as Chinese offshore wind projects have grown in scale and complexity the need for international expertise in the market has increased, with World Bank support for emerging markets underscoring global momentum. In response, domestic insurers are partnering with international reinsurers to manage and mitigate the associated larger risks. Applying the higher standards required by international reinsurers, LOC Renewables will draw on its extensive experience in European, US and Asian offshore wind markets to provide MWS services on the Pinghai project from its Tianjin office.

“As offshore wind technology continues to proliferate across Asia, driven by declining global costs, successful knowledge transfer based on best practices and lessons learned in the established offshore wind markets becomes ever more important,” said Ke Wan, Managing Director, LOC China.

“With a wealth of experience in Europe and the US, where UK offshore wind growth has accelerated, we’re increasingly working on projects across Asia, and are delighted to now be providing the first MWS services to China’s offshore wind market – services that bring real value in lower risk and will enable the project to achieve its full potential.”

“At 250MW, phase two of the Pinghai Bay Wind Farm represents a significant expansion on phase one, and we wanted to ensure that it met the highest technical and risk mitigation standards, informed by regional learnings such as Korean installation vessels analyses,” said Fan Ming, Business Director at Haixia Goldenbridge Insurance.

“In addition to their global experience, LOC Renewables’ familiarity with and presence in the local market was very important to us, and we’re looking forward to working closely with them to help bring this project to fruition and make a significant contribution to China’s expanding offshore wind market.”


Related News

View more

Sign Up for Electricity Forum’s Newsletter

Stay informed with our FREE Newsletter — get the latest news, breakthrough technologies, and expert insights, delivered straight to your inbox.

Electricity Today T&D Magazine Subscribe for FREE

Stay informed with the latest T&D policies and technologies.
  • Timely insights from industry experts
  • Practical solutions T&D engineers
  • Free access to every issue

Live Online & In-person Group Training

Advantages To Instructor-Led Training – Instructor-Led Course, Customized Training, Multiple Locations, Economical, CEU Credits, Course Discounts.

Request For Quotation

Whether you would prefer Live Online or In-Person instruction, our electrical training courses can be tailored to meet your company's specific requirements and delivered to your employees in one location or at various locations.