AECL focuses its energies to win domestic market

By Canada News Wire


NFPA 70e Training

Our customized live online or in‑person group training can be delivered to your staff at your location.

  • Live Online
  • 6 hours Instructor-led
  • Group Training Available
Regular Price:
$199
Coupon Price:
$149
Reserve Your Seat Today
Atomic Energy of Canada Limited announced that it is focusing its marketing and licensing resources for the Advanced CANDU Reactor (ACR-1000) on the immediate needs of the Canadian domestic marketplace.

"The nuclear renaissance has taken hold in Canada as several Canadian provinces are currently considering the ACR as the technology-of-choice for the next generation nuclear technology," says AECL's President and Chief Executive Officer Hugh MacDiarmid. "We believe very strongly that our best course of action to ensure the ACR-1000 is successful in the global market place is to focus first and foremost on establishing it here at home."

Given this new direction, AECL has notified the United Kingdom's nuclear regulators that it will suspend participation of its ACR design in Step 3 of the UK's new build reactor Generic Design Assessment but may re-enter at a later date. The UK regulators - the Health and Safety Executive and the Environment Agency - had announced in March that the ACR and AECL's design program had passed the Step 2 assessment of stringent safety, security and environmental criteria and was eligible to proceed to Step 3.

Mr. MacDiarmid added, "We want to dedicate our resources for the ACR to the markets in Canada. By taking this action now we are well positioned to meet our customer's expectations for product performance, as well as on time and on budget project delivery. We continue to actively pursue opportunities for our CANDU 6 product in several international markets."

Related News

Improve US national security, step away from fossil fuels

American Green Energy Independence accelerates electrification and renewable energy, leveraging solar, wind, and EVs to boost energy security, cut emissions, create jobs, and reduce reliance on volatile oil and natural gas markets influenced by geopolitics.


Key Points

American Green Energy Independence is a strategy to electrify, expand renewables, and enhance energy security.

✅ Electrifies vehicles, appliances, and infrastructure

✅ Expands solar, wind, and storage to stabilize grids

✅ Cuts oil dependence, strengthens energy security and jobs


As Putin's heavy hand uses Russia's power over oil and natural gas as a weapon against Europe, which is facing an energy nightmare across its markets, and the people of Ukraine, it's impossible not to wonder how we can mitigate the damages he's causing. Simultaneously, it's a devastating reminder of the freedom we so often take for granted and a warning to increase our energy independence as a nation. There are many ways we can, but one of the best is to follow the lead of the European Union and quicken our transition to green and renewable energies.

We've known it for a long time: our reliance on fossil fuels is a national security risk. Volatile prices coupled with our extreme demand mean that concerns over fossil fuel access have driven foreign policy decisions. We've seen it happen countless times — most notably during the wars in Iraq and Afghanistan — and it's played out again in Ukraine, which has leaned on imports to keep the lights on during the crisis. Concerned by Russia's power over the oil and natural gas market, the US and Europe were quite reluctant to impose the harshest, most recent sanctions because doing so will hurt their citizens' pocketbooks.

As homeowners, we know how much decisions like these can hurt, especially with gas prices being historically high even as an energy crisis isn't spurring a green shift for many consumers. However, the solution to this problem isn't to drill more, as some well-funded oil and gas interest groups have claimed. Doing so likely won't even provide a short-term solution to the problem as it takes six months to a year at minimum to build a new well with all its associated infrastructure.

The best long-term solution is to declare our independence from the global oil market amid a global energy war that is driving price hikes and invest in American-made clean energy. We need to electrify our vehicles, appliances, and infrastructure, and make America fully energy independent. This will save families thousands of dollars a year, make our country more self-sufficient, and provide hundreds of thousands of quality jobs here in the Midwest.

Already, over 600,000 Midwesterners are employed in clean-energy professions, and they make 25 percent more than the national median wage. Nationally, clean energy is the biggest job creator in our country's energy sector, employing almost three times as many workers as the fossil fuel industry.

As we employ our own citizens, we will defund Putin's Russia, which has long been funded by his powerful oil and gas industry. Instead of diversifying his economy during the oil boom of the 2010s, Putin doubled down on petroleum. We should exploit his weakness by leading a global movement to abandon the very resource that funds his warmongering. Doing so will further destabilize his economy and protect the citizens of Ukraine, especially as they prepare for winter amid energy challenges today.

We can start doing this as everyday consumers by seeking electric options like stoves, cars, or other appliances. Congress should help Americans afford these changes by providing tax credits for everyday Americans and innovators in electric vehicle and green energy industries. Doing so will spur innovation in the industry, further reducing the cost to consumers. We should also ensure that our semiconductors, solar panels, wind turbines, and other technology needed for a green future are manufactured and assembled in America. This will ensure that our energy industry is safe from price or supply shocks and reduce brownout risks linked to disruptions caused by an international crisis like the invasion of Ukraine.

In many ways, our next steps as a country can define world history for generations to come. Will we continue our reliance on oil and its tacit support of Putin's economy? Or will we intensify our shift to green energies and make our country more self-sufficient and secure? The global spotlight is on us once again to lead. We hope our country will honor the lives of its veterans and the soldiers fighting in Ukraine by strengthening energy security support and transitioning towards green energy.


Related News

View more

Rolls-Royce expecting UK approval for mini nuclear reactor by mid-2024

Rolls-Royce SMR UK Approval underscores nuclear innovation as regulators review a 470 MW factory-built modular reactor, aiming for grid power by 2029 to boost energy security, cut fossil fuels, and accelerate decarbonization.


Key Points

UK regulatory clearance for Rolls-Royce's 470 MW modular reactor, targeting grid power by 2029 to support clean energy.

✅ UK design approval expected by mid 2024

✅ First 470 MW unit aims for grid power by 2029

✅ Modular, factory-built; est. £1.8b per 10-acre site


A Rolls-Royce (RR.L) design for a small modular nuclear reactor (SMR) will likely receive UK regulatory approval by mid-2024, reflecting progress seen in the US NRC safety evaluation for NuScale as a regulatory benchmark, and be able to produce grid power by 2029, Paul Stein, chairman of Rolls-Royce Small Modular Reactors.

The British government asked its nuclear regulator to start the approval process in March, in line with the UK's green industrial revolution agenda, having backed Rolls-Royce’s $546 million funding round in November to develop the country’s first SMR reactor.

Policymakers hope SMRs will help cut dependence on fossil fuels and lower carbon emissions, as projects like Ontario's first SMR move ahead in Canada, showing momentum.

Speaking to Reuters in an interview conducted virtually, Stein said the regulatory “process has been kicked off, amid broader moves such as a Canadian SMR initiative to coordinate development, and will likely be complete in the middle of 2024.

“We are trying to work with the UK Government, and others to get going now placing orders, echoing expansions like Darlington SMR plans in Ontario, so we can get power on grid by 2029.”

In the meantime, Rolls-Royce will start manufacturing parts of the design that are most unlikely to change, while advancing partnerships like a MoU with Exelon to support deployment, Stein added.

Each 470 megawatt (MW) SMR unit costs 1.8 billion pounds ($2.34 billion) and would be built on a 10-acre site, the size of around 10 football fields, though projects in New Brunswick SMR debate have prompted questions about costs and timelines.

Unlike traditional reactors, SMRs are cheaper and quicker to build and can also be deployed on ships and aircraft. Their “modular” format means they can be shipped by container from the factory and installed relatively quickly on any proposed site.


Related News

View more

UK low-carbon electricity generation stalls in 2019

UK low-carbon electricity 2019 saw stalled growth as renewables rose slightly, wind expanded, nuclear output fell, coal hit record lows, and net-zero targets demand faster deployment to cut CO2 intensity below 100gCO2/kWh.


Key Points

Low-carbon sources supplied 54% of UK power in 2019, up just 1TWh; wind grew, nuclear fell, and coal dropped to 2%.

✅ Wind up 8TWh; nuclear down 9TWh amid outages

✅ Fossil fuels 43% of generation; coal at 2%

✅ Net-zero needs 15TWh per year added to 2030


The amount of electricity generated by low-carbon sources in the UK stalled in 2019, Carbon Brief analysis shows.

Low-carbon electricity output from wind, solar, nuclear, hydro and biomass rose by just 1 terawatt hour (TWh, less than 1%) in 2019. It represents the smallest annual increase in a decade, where annual growth averaged 9TWh. This growth will need to double in the 2020s to meet UK climate targets while replacing old nuclear plants as they retire.

Some 54% of UK electricity generation in 2019 came from low-carbon sources, including 37% from renewables and 20% from wind alone, underscoring wind's leading role in the power mix during key periods. A record-low 43% was from fossil fuels, with 41% from gas and just 2% from coal, also a record low. In 2010, fossil fuels generated 75% of the total.

Carbon Brief’s analysis of UK electricity generation in 2019 is based on figures from BM Reports and the Department for Business, Energy and Industrial Strategy (BEIS). See the methodology at the end for more on how the analysis was conducted.

The numbers differ from those published earlier in January by National Grid, which were for electricity supplied in Great Britain only (England, Wales and Scotland, but excluding Northern Ireland), including via imports from other countries.

Low-carbon low
In 2019, the UK became the first major economy to target net-zero greenhouse gas emissions by 2050, increasing the ambition of its legally binding Climate Change Act.

To date, the country has cut its emissions by around two-fifths since 1990, with almost all of its recent progress coming from the electricity sector.

Emissions from electricity generation have fallen rapidly in the decade since 2010 as coal power has been almost phased out and even gas output has declined. Fossil fuels have been displaced by falling demand and by renewables, such as wind, solar and biomass.

But Carbon Brief’s annual analysis of UK electricity generation shows progress stalled in 2019, with the output from low-carbon sources barely increasing compared to a year earlier.

The chart below shows low-carbon generation in each year since 2010 (grey bars) and the estimated level in 2019 (red). The pale grey bars show the estimated future output of existing low-carbon sources after old nuclear plants retire and the pale red bars show the amount of new generation needed to keep electricity sector emissions to less than 100 grammes of CO2 per kilowatt hour (gCO2/kWh), the UK’s nominal target for the sector.

 Annual electricity generation in the UK by fuel, terawatt hours, 2010-2019. Top panel: fuel by fuel. Bottom panel: cumulative total generation from all sources. Source: BEIS energy trends, BM Reports and Carbon Brief analysis. Chart by Carbon Brief using Highcharts.
As the chart shows, the UK will require significantly more low-carbon electricity over the next decade as part of meeting its legally binding climate goals.

The nominal 100gCO2/kWh target for 2030 was set in the context of the UK’s less ambitious goal of cutting emissions to 80% below 1990 levels by 2050. Now that the country is aiming to cut emissions to net-zero by 2050, that 100gCO2/kWh indicator is likely to be the bare minimum.

Even so, it would require a rapid step up in the pace of low-carbon expansion, compared to the increases seen over the past decade. On average, low-carbon generation has risen by 9TWh each year in the decade since 2010 – including a rise of just 1TWh in 2019.

Given scheduled nuclear retirements and rising demand expected by the Committee on Climate Change (CCC) – with some electrification of transport and heating – low-carbon generation would need to increase by 15TWh each year until 2030, just to meet the benchmark of 100gCO2/kWh.

For context, the 3.2 gigawatt (GW) Hinkley C new nuclear plant being built in Somerset will generate around 25TWh once completed around 2026. The world’s largest offshore windfarm, the 1.2GW Hornsea One scheme off the Yorkshire coast, will generate around 5TWh each year.

The new Conservative government is targeting 40GW of offshore wind by 2030, up from today’s figure of around 8GW. If policies are put in place to meet this goal, then it could keep power sector emissions below 100gCO2/kWh, depending on the actual performance of the windfarms built.

However, new onshore wind and solar, further new nuclear or other low-carbon generation, such as gas with carbon capture and storage (CCS), is likely to be needed if demand is higher than expected, or if the 100gCO2/kWh benchmark is too weak in the context of net-zero by 2050.

The CCC says it is “likely” to “reflect the need for more rapid deployment” of low-carbon towards net-zero emissions in its advice on the sixth UK carbon budget for 2033-2037, due in September.

Trading places
Looking more closely at UK electricity generation in 2019, Carbon Brief’s analysis shows why there was so little growth for low-carbon sources compared to the previous year.

There was another increase for wind power in 2019 (up 8TWh, 14%), with record wind generation as several large new windfarms were completed including the 1.2GW Hornsea One project in October and the 0.6GW Beatrice offshore windfarm in Q2 of 2019. But this was offset by a decline for nuclear (down 9TWh, 14%), due to ongoing outages for reactors at Hunterston in Scotland and Dungeness in Kent.

(Analysis of data held by trade organisation RenewableUK suggests some 0.6GW of onshore wind capacity also started operating in 2019, including the 0.2GW Dorenell scheme in Moray, Scotland.)

As a result of these movements, the UK’s windfarms overtook nuclear for the first time ever in 2019, becoming the country’s second-largest source of electricity generation, and earlier, wind and solar together surpassed nuclear in the UK as momentum built. This is shown in the figure below, with wind (green line, top panel) trading places with nuclear (purple) and gas (dark blue) down around 25% since 2010 but remaining the single-largest source.

 Annual electricity generation in the UK by fuel, terawatt hours, 2010-2019. Top panel: fuel by fuel. Bottom panel: cumulative total generation from all sources. Source: BEIS energy trends, BM Reports and Carbon Brief analysis. Chart by Carbon Brief using Highcharts.
The UK’s currently suspended nuclear plants are due to return to service in January and March, according to operator EDF, the French state-backed utility firm. However, as noted above, most of the UK’s nuclear fleet is set to retire during the 2020s, with only Sizewell B in Suffolk due to still be operating by 2030. Hunterston is scheduled to retire by 2023 and Dungeness by 2028.

Set against these losses, the UK has a pipeline of offshore windfarms, secured via “contracts for difference” with the government, at a series of auctions. The most recent auction, in September 2019, saw prices below £40 per megawatt hour – similar to current wholesale electricity prices.

However, the capacity contracted so far is not sufficient to meet the government’s target of 40GW by 2030, meaning further auctions – or some other policy mechanism – will be required.

Coal zero
As well as the switch between wind and nuclear, 2019 also saw coal fall below solar for the first time across a full year, echoing the 2016 moment when wind outgenerated coal across the UK, after it suffered another 60% reduction in electricity output. Just six coal plants remain in the UK, with Aberthaw B in Wales and Fiddlers Ferry in Cheshire closing in March.

Coal accounted for just 2% of UK generation in 2019, a record-low coal share since centralised electricity supplies started to operate in 1882. The fuel met 40% of UK needs as recently as 2012, but has plummeted thanks to falling demand, rising renewables, cheaper gas and higher CO2 prices.

The reduction in average coal generation hides the fact that the fuel is now often not required at all to meet the UK’s electricity needs. The chart below shows the number of days each year when coal output was zero in 2019 (red line) and the two previous years (blue).

 Cumulative number of days when UK electricity generation from renewable sources has been higher than that from fossil fuels. Source: BEIS energy trends, BM Reports and Carbon Brief analysis. Chart by Carbon Brief using Highcharts.
The 83 days in 2019 with zero coal generation amount to nearly a quarter of the year and include the record-breaking 18-day stretch without the fuel.

Great Britain has been running for a record TWO WEEKS without using coal to generate electricity – the first time this has happened since 1882.

The country’s grid has been coal-free for 45% of hours in 2019 so far.https://www.carbonbrief.org/countdown-to-2025-tracking-the-uk-coal-phase-out …

Coal generation was set for significant reductions around the world in 2019 – including a 20% reduction for the EU as a whole – according to analysis published by Carbon Brief in November.

Notably, overall UK electricity generation fell by another 9TWh in 2019 (3%), bringing the total decline to 58TWh since 2010. This is equivalent to more than twice the output from the Hinkley C scheme being built in Somerset. As Carbon Brief explained last year, falling demand has had a similar impact on electricity-sector CO2 emissions as the increase in output from renewables.

This is illustrated by the fact that the 9TWh reduction in overall generation translated into a 9TWh (6%) cut in fossil-fuel generation during 2019, with coal falling by 10TWh and gas rising marginally.

Increasingly renewable
As fossil-fuel output and overall generation have declined, the UK’s renewable sources of electricity have continued to increase. Their output has risen nearly five-fold in the past decade and their share of the UK total has increased from 7% in 2010 to 37% in 2019.

As a result, the UK’s increasingly renewable grid is seeing more minutes, hours and days during which the likes of wind, solar and biomass collectively outpace all fossil fuels put together, and on some days wind is the main source as well.

The chart below shows the number of days during each year when renewables generated more electricity than fossil fuels in 2019 (red line) and each of the previous four years (blue lines). In total, nearly two-fifths of days in 2019 crossed this threshold.

 Cumulative number of days when the UK has not generated any electricity from coal. Source: BEIS energy trends, BM Reports and Carbon Brief analysis. Chart by Carbon Brief using Highcharts.
There were also four months in 2019 when renewables generated more of the UK’s electricity than fossil fuels: March, August, September and December. The first ever such month came in September 2018 and more are certain to follow.

National Grid, which manages Great Britain’s high-voltage electricity transmission network, is aiming to be able to run the system without fossil fuels by 2025, at least for short periods. At present, it sometimes has to ask windfarm operators to switch off and gas plants to start running in order to keep the electricity grid stable.

Note that biomass accounted for 11% of UK electricity generation in 2019, nearly a third of the total from all renewables. Some two-thirds of the biomass output is from “plant biomass”, primarily wood pellets burnt at Lynemouth in Northumberland and the Drax plant in Yorkshire. The remainder was from an array of smaller sites based on landfill gas, sewage gas or anaerobic digestion.

The CCC says the UK should “move away” from large-scale biomass power plants, once existing subsidy contracts for Drax and Lynemouth expire in 2027.

Using biomass to generate electricity is not zero-carbon and in some circumstances could lead to higher emissions than from fossil fuels. Moreover, there are more valuable uses for the world’s limited supply of biomass feedstock, the CCC says, including carbon sequestration and hard-to-abate sectors with few alternatives.

Methodology
The figures in the article are from Carbon Brief analysis of data from BEIS Energy Trends chapter 5 and chapter 6, as well as from BM Reports. The figures from BM Reports are for electricity supplied to the grid in Great Britain only and are adjusted to include Northern Ireland.

In Carbon Brief’s analysis, the BM Reports numbers are also adjusted to account for electricity used by power plants on site and for generation by plants not connected to the high-voltage national grid. This includes many onshore windfarms, as well as industrial gas combined heat and power plants and those burning landfill gas, waste or sewage gas.

By design, the Carbon Brief analysis is intended to align as closely as possible to the official government figures on electricity generated in the UK, reported in BEIS Energy Trends table 5.1.

Briefly, the raw data for each fuel is in most cases adjusted with a multiplier, derived from the ratio between the reported BEIS numbers and unadjusted figures for previous quarters.

Carbon Brief’s method of analysis has been verified against published BEIS figures using “hindcasting”. This shows the estimates for total electricity generation from fossil fuels or renewables to have been within ±3% of the BEIS number in each quarter since Q4 2017. (Data before then is not sufficient to carry out the Carbon Brief analysis.)

For example, in the second quarter of 2019, a Carbon Brief hindcast estimates gas generation at 33.1TWh, whereas the published BEIS figure was 34.0TWh. Similarly, it produces an estimate of 27.4TWh for renewables, against a BEIS figure of 27.1TWh.

National Grid recently shared its own analysis for electricity in Great Britain during 2019 via its energy dashboard, which differs from Carbon Brief’s figures.


Related News

View more

Solar changing shape of electricity prices in Northern Europe

EU Solar Impact on Electricity Prices highlights how rising solar PV penetration drives negative pricing, shifts peak hours, pressures wholesale markets, and challenges grid balancing, interconnection, and flexibility amid changing demand and renewables growth.


Key Points

Explains how rising solar PV cuts wholesale prices, shifts negative-price hours, and strains grid flexibility.

✅ Negative pricing events surge with higher solar penetration.

✅ Afternoon price dips replace night-time wind-led lows.

✅ Grid balancing, interconnectors, and flexibility become critical.


The latest EU electricity market report has confirmed the affect deeper penetration of solar is having on wholesale electricity prices more broadly.

The Quarterly Report on European Electricity Markets for the final three months of last year noted the number of periods of negative electricity pricing doubled from 2019, to almost 1,600 such events, as global renewables set new records in deployment across markets.

Having experienced just three negative price events in 2019, the Netherlands recorded almost 100 last year “amid a dramatic increase in solar PV capacity,” in the nation, according to the report.

Whilst stressing the exceptional nature of the Covid-19 pandemic on power consumption patterns, the quarterly update also noted a shift in the hours during which negative electric pricing occurred in renewables poster child Germany. Previously such events were most common at night, during periods of high wind speed and low demand, but 2020 saw a switch to afternoon negative pricing. “Thus,” stated the report, “solar PV became the main driver behind prices falling into negative territory in the German market in 2020, as Germany's solar boost accelerated, and also put afternoon prices under pressure generally.”

The report also highlighted two instances of scarce electricity–in mid September and on December 9–as evidence of the problems associated with accommodating a rising proportion of intermittent clean energy capacity into the grid, and called for more joined-up cross-border power networks, amid pushback from Russian oil and gas across the continent.

Rising solar generation–along with higher gas output, year on year–also helped the Netherlands generate a net surplus of electricity last year, after being a net importer “for many years.” The EU report also noted a beneficial effect of rising solar generation capacity on Hungary‘s national electricity account, and cited a solar “boom” in that country and Poland, mirroring rapid solar PV growth in China in recent years.

With Covid-19 falls in demand helping renewables generate more of Europe's electricity (39%) than fossil fuels (36%) for the first time, as renewables surpassed fossil fuels across Europe, the market report observed the 5% of the bloc's power produced from solar closed in on the 6% accounted for by hard coal. In the final three months of the year, European solar output rose 12%, year on year, to 18 TWh and “the increase was almost single-handedly driven by Spain,” the study added.

With coal and lignite-fired power plunging 22% last year across the bloc, it is estimated the European power sector reduced its carbon footprint 14% as part of Europe's green surge although the quarterly report warned cold weather, lower wind speeds and rising gas prices in the opening months of this year are likely to see carbon emissions rebound.

There was good news on the transport front, though, with the report stating the scale of the European “electrically-charged vehicle” fleet doubled in 2020, to 2 million, with almost half a million of the new registrations arriving in the final months of the year. That meant cars with plug sockets accounted for a remarkable 17% of new purchases in Q4, twice the proportion seen in China and a slice of the pie six times bigger than such products claimed in the U.S.


Related News

View more

Portsmouth residents voice concerns over noise, flicker generated by turbine

Portsmouth Wind Turbine Complaints highlight noise, shadow flicker, resident impacts, Town Council hearings, and Green Development mitigation plans near Portsmouth High School, covering renewable energy output, PPAs, and community compliance.


Key Points

Resident reports of noise and shadow flicker near Portsmouth High School, prompting review and mitigation efforts.

✅ Noise exceeds ambient levels seasonally, residents report fatigue.

✅ Shadow flicker lasts up to 90 minutes on affected homes.

✅ Town tasks developer to meet neighbors and propose mitigation.


The combination of the noise and shadows generated by the town’s wind turbine has rankled some neighbors who voiced their frustration to the Town Council during its meeting Monday.

Mark DePasquale, the founder and chairman of the company that owns the turbine, tried to reassure them with promises to address the bothersome conditions.

David Souza, a lifelong town resident who lives on Lowell Drive, showed videos of the repeated, flashing shadows cast on his home by the three blades spinning.

“I am a firefighter. I need to get my sleep,” he said. “And now it’s starting to affect my job. I’m tired.”

Town Council President Keith Hamilton tasked DePasquale with meeting with the neighbors and returning with an update in a month. “What I do need you to do, Mr. DePasquale, is to follow through with all these people.”

DePasquale said he was unaware of the flurry of complaints lodged by the residents Monday. His company had only heard of one complaint. “If I knew there was an issue before tonight, we would have responded,” he said.

His company, Green Development LLC, formerly Wind Energy Development LLC, installed the 279-foot-tall turbine near Portsmouth High School that started running in August 2016, as offshore developers like Deepwater Wind in Massachusetts plan major construction nearby. It replaced another turbine installed by a separate company that broke down in 2012.

In November 2014, the town signed an agreement with Wind Energy Development to take down the existing turbine, pay off the remaining $1.45 million of the bond the town took out to install it and put up a new turbine, amid broader legal debates like the Cornwall wind farm ruling that can affect project timelines.

In exchange, Wind Energy Development sells a portion of the energy generated by the turbine to the town at a rate of 15.5 cents per kilowatt hour for 25 years. Some of the energy generated is sold to the town of Coventry.

“We took down (the old turbine) and paid off the debt,” DePasquale said, noting that cancellations can carry high costs as seen in Ontario wind project penalties for scrapping projects. “I have no problem doing whatever the council wants … There was an economic decision made to pay off the bond and build something better.”

The turbine was on pace to produce 4 million-plus kilowatt hours per year, Michelle Carpenter, the chief operating officer of Wind Energy Development, said last April. It generates enough energy to power all municipal and school buildings in town, she said, while places like Summerside’s wind power show similarly strong output.

The constant stream of shadows cast on certain homes in the area can last for as long as an hour-and-a-half, according to Souza. “We shouldn’t have to put up with this,” he said.

Sprague Street resident John Vegas said the turbine’s noise, especially in late August, is louder than the neighborhood’s ambient noise.

“Throughout the summer, there’s almost no flicker, but this time of year it’s very prominent,” Vegas added. “It can be every day.”

He mentioned neighbors needed to be better organized to get results.

“When the residents purchased our properties we did not have this wind turbine in our backyard,” Souza said in a memo. “Due to the wind turbine … our quality of life has suffered.”

After the discussion, the council unanimously voted to allow Green Development to sublease excess energy to the Rhode Island Convention Center Authority, a similar agreement to the one the company struck with Coventry, as regional New England solar growth adds pressure on grid upgrade planning.

“This has to be a sustainable solution,” DePasquale said. “We will work together with the town on a solution.”


Related News

View more

FPL stages massive response to Irma but power may not be back for days or weeks

FPL Power Restoration mobilizes Florida linemen and mutual-aid utility crews to repair the grid, track outages with smart meters, prioritize hospitals and essential services, and accelerate hurricane recovery across the state.


Key Points

FPL Power Restoration is the utility's hurricane effort to rebuild the grid and quickly restore service across Florida.

✅ 18,000 mutual-aid utility workers deployed from 28 states

✅ Smart meters pinpoint outages and accelerate repairs

✅ Critical facilities prioritized before neighborhood restorations


Teams of Florida Power & Light linemen, assisted by thousands of out-of-state utility workers and 200 Ontario workers who joined the effort, scrambled across Florida Monday to tackle the Herculean task of turning the lights back on in the Sunshine State.

The job is quite simply mind-boggling as Irma caused extensive damages to the power grid and the outages have broken previous records, and in other storms Louisiana's grid needed a complete rebuild after Hurricane Laura to restore service.

By 3 p.m. Monday, some 3.47 million of the company's 4.9 million customers in Florida were without power. This breaks the record of 3.24 million knocked off the grid during Hurricane Wilma in 2005, according to FPL spokesman Bill Orlove.

Prepared to face massive outages, FPL brought some 18,000 utility workers from 28 states here to join FPL crews, including Canadian power crews arriving to help restore service, to enable them to act more quickly.

“That’s the thing about the utility industry,” said  Alys Daly, an FPL spokeswoman. “It’s truly a family.”

Even with what is believed to be the largest assembly of utility workers ever assembled for a single storm in the United States, power restoration is expected to take weeks, not days in some areas.

FPL vowed to work as quickly as possible as they assess the damage and send out crews to restore power.

"We understand that people need to have power right away to get their lives back to normal," Daly said.

The priority, she said, were medical and emergency management facilities and then essential service providers like gas stations and grocery stores.

After that, FPL will endeavor to repair the problems that will restore power to the maximum number of people possible. Then it's individual neighborhoods.

As of 3 p.m. Monday, 219,040 of FPL's 307,600 customers on the Space Coast had no power. That's an improvement over the 260,600 earlier in the day.

Daly was unable to say Monday how many crews FPL had working in Brevard County. In some areas, power came back relatively swiftly, much quicker than expected.

" I was definitely surprised at how quickly they got our power back on here in NE Palm Bay," said Kelli Coats. "We lost power last night around 9 p.m Sunday and regained power around 8:30 a.m. today."

Others, many of them beachside, were looking at a full 24 hours without power and it's possible it could extend into Tuesday or longer.

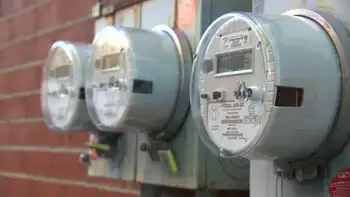
One reason for improved response times since 2005, Daly said, is the installation of nearly 5 million "Smart Meters" at residences. These new devices, which replaced older analog models, allows FPL crews to track a neighborhood's power status via handheld computers, pinpointing the cause of an outage so it can be repaired.

Quick restoration is key as stores and restaurants struggle to re-open, and Gulf Power crews restored power in the early push. Without electricity many of them just can't re-start operations and get goods and services to consumers.

At the Atlanta-based Waffle House, which Federal Emergency Management Administration use to gauge the severity of damage and service to an area, restaurant executives are reviewing its operations in Florida and should have a better handle Monday afternoon how quickly restaurants will re-open.

"Right now, we're in an assessment phase," said Pat Warner, spokesman for Waffle House. "We're looking at which stores have power and which ones have damage."

FEMA's color-coded Waffle House Index started after the hurricanes in the early 2000s. It works like this: When an official phones a Waffle House to see if it is open,  the next stop is to assess it's level of service. If it's open and serving a full menu, the index is green. When the restaurant is open but serving a limited menu, it's yellow. When it's closed, it's red.


Related News

View more

Sign Up for Electricity Forum’s Newsletter

Stay informed with our FREE Newsletter — get the latest news, breakthrough technologies, and expert insights, delivered straight to your inbox.

Electricity Today T&D Magazine Subscribe for FREE

Stay informed with the latest T&D policies and technologies.
  • Timely insights from industry experts
  • Practical solutions T&D engineers
  • Free access to every issue

Download the 2025 Electrical Training Catalog

Explore 50+ live, expert-led electrical training courses –

  • Interactive
  • Flexible
  • CEU-cerified