NYISO wind forecasts to help green the grid

By Business Wire


NFPA 70b Training - Electrical Maintenance

Our customized live online or in‑person group training can be delivered to your staff at your location.

  • Live Online
  • 12 hours Instructor-led
  • Group Training Available
Regular Price:
$599
Coupon Price:
$499
Reserve Your Seat Today
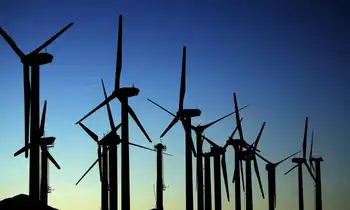
The New York Independent System Operator (NYISO) will incorporate a centralized wind forecasting system to better accommodate wind power in New YorkÂ’s bulk electricity grid.

The wind-forecasting system, planned for implementation this summer, is one of many steps being taken by the NYISO to recognize and incorporate the unique characteristics and variable nature of wind power in dispatching resources to economically serve the StateÂ’s electric load.

The NYISO has contracted with AWS Truewind, of Colonie, N.Y., to implement the wind-forecasting capability. The ability to more accurately forecast wind allows the NYISO to gauge how much wind power is likely to be available throughout a given day, enabling maximum use of “green power” resources while enhancing reliability by anticipating variations in generator output.

“As fuel costs climb and the need for emission-free electricity grows, it is important to realize the full potential of renewable energy resources such as wind. The NYISO is committed to accommodating the market entry of any and all new technologies and renewable resources,” said Karen Antion, the NYISO’s Board Chair and interim CEO.

“As more wind power projects are connected to the grid, they will require enhanced attention. The advance forecasts will allow us to accommodate wind power more accurately and reliably,” said Robert Hiney, a NYISO Board member and interim President.

The variable nature of wind generation poses special challenges to grid operators, such as the NYISO, who must constantly balance the supply of and demand for electricity on the grid because electricity cannot be stored efficiently with current technologies.

To produce the forecasts, wind generators will send meteorological data and the NYISO will send power data to AWS Truewind. The company will provide wind power forecasts to the NYISO, which will use the information to integrate wind power in balancing the supply of electricity with consumer demand.

The NYISO has also proposed wind-related revisions in market rules, which are subject to approval by the Federal Energy Regulatory Commission (FERC). The proposals include:

• Increasing the amount of wind generation eligible for exemption from under-generation penalties and full compensation for over-generation,

• Requiring wind projects to finance the costs of the centralized forecasting service, and

• Establishing penalties for wind generators who continually fail to deliver meteorological data to the NYISO forecaster.

Currently, there are nearly 500 megawatts of wind generating capacity in commercial operation in New York State. Almost 7,000 megawatts of proposed wind generation projects are proceeding through the grid interconnection process administered by the NYISO.

According to the American Wind Energy Association (AWEA), independently operated wholesale electricity markets, such as those administered by the NYISO, are enabling greater amounts of wind power to be integrated into the nationÂ’s electric grid. In 2007, AWEA reported that regions served by independently operated wholesale electricity markets had approximately 73 percent of installed wind capacity, despite having only 44 percent of nationÂ’s wind power potential.

Related News

Electricity Payouts on Biggest U.S. Grid Fall 64 Per Cent in Auction

PJM Capacity Auction Price Drop signals PJM Interconnection capacity market shifts, with $50/MW-day clearing, higher renewables and nuclear participation, declining coal, natural gas pressure, and zone impacts in ComEd and EMAAC, amid 21% reserve margins.


Key Points

A decline to $50 per MW-day in PJM capacity prices, shifting resource mix, zonal rates, and reserve margins.

✅ Clearing price fell to $50/MW-day from $140 in 2018

✅ Renewables and nuclear up; coal units down across PJM

✅ Zonal prices: ComEd $68.96, EMAAC $97.86; 21% reserves


Power-plant owners serving the biggest U.S. grid will be paid 64% less next year for being on standby to keep the lights on from New Jersey to Illinois.

Suppliers to PJM Interconnection LLC’s grid, which serves more than 65 million people, will get $50 a megawatt-day to provide capacity for the the year starting June 2022, according to the results of an auction released Wednesday. That’s down sharply from $140 in the previous auction, held in 2018. Analysts had expected the price would fall to about $85.

“Renewables, nuclear and new natural gas generators saw the greatest increases in cleared capacity, while coal units saw the largest decrease,” PJM said in a statement.

The PJM auction is the single most important event for power generators across the eastern U.S., including Calpine Corp., NRG Energy Inc. and Exelon Corp., because it dictates a big chunk of their future revenue. It also plays a pivotal role in shaping the region’s electricity mix, determining how much the region is willing to stick with coal and natural gas plants or replace them with wind and solar even as the aging grid complicates progress nationwide.

The results showed that the capacity price for the Chicago-area zone, known as ComEd, was $68.96 compared with $195.55 in the last auction. The price for the Pennsylvania and New Jersey zone, known as EMAAC, fell to $97.86 percent, from $165.73. All told, 144,477 megawatts cleared, representing a reserve margin of 21%.

Exelon shares fell 0.4% after the results were released. Vistra fell 1.5%. NRG was unchanged.

Blackouts triggered by extreme weather in Texas and California over the last year have reignited a debate over whether other regions should institute capacity systems similar to the one used by PJM, and whether to adopt measures like emergency fuel stock programs in New England as well. The market, which pays generators to be on standby in case extra power is needed, has long been a source of controversy. While it makes the grid more reliable, the system drives up costs for consumers. In the area around Chicago, for instance, these charges total more than $1.7 billion per year, accounting for 20% of customer bills, according to the Illinois Clean Jobs Coalition.

In the 2018 auction, PJM contracted supplies that were about 22% in excess of the peak demand projection at the time. This year, the grid is projected to start summer with a reserve margin of about 26%, as COVID-19 demand shifts persist, according to the market monitor -- far higher than the 16% most engineers say is needed to prevent major outages.

“This certainly doesn’t seem fair to ratepayers,” said Ari Peskoe, director of Harvard Law School’s Electricity Law Initiative.

Fossil-Fuel Advantage
Heading into the auction, analysts expected coal and gas plants to have the advantage. Nuclear reactors and renewables, they said, were poised to struggle amid coal and nuclear disruptions nationwide.

That’s because this is the first PJM auction run under a major pricing change imposed by federal regulators during the Trump administration. The new structure creates a price floor for some bidders, effectively hobbling nuclear and renewables that receive state subsidies while making it easier for fossil fuels to compete.

Those rules triggered contentious wrangling between power providers, PJM and federal regulators, delaying the auction for two years. The new system, however, may be short lived. The Biden administration is moving to overhaul the rules in time for the next auction in December.

Also See: Biden Climate Goals to Take Backseat in Biggest U.S. Power Grid

Dominion Energy Inc., one of the biggest U.S. utility owners, pulled out of the market over the rules. The Virginia-based company, which has a goal to have net-zero carbon emissions by 2050, said the new PJM format will “make renewables more expensive” than delivering clean energy through alternative markets.

Illinois, New Jersey and Maryland have also threatened to leave the capacity market unless the new price floor is eliminated, and Connecticut is leading a market overhaul in New England as well. PJM has already launched a process to do it.

PJM is already one of the most fossil-fuel intensive grids, with 60% of its electricity coming from coal and gas. Power plants that bid into the auction rely on it for the bulk of their revenue. That means plants that win contracts have an incentive to continue operating for as long as they can, even amid a supply-chain crisis this summer.


Related News

View more

Britain's energy security bill set to become law

UK Energy Security Bill drives private investment, diversifies from fossil fuels with hydrogen and offshore wind, strengthens an independent system operator, and extends the retail price cap to shield consumers from volatile gas markets.


Key Points

A UK plan to reform energy, cut fossil fuel reliance, boost hydrogen and wind, and extend the retail price cap.

✅ Targets £100bn private investment and 480,000 jobs by 2030.

✅ Creates an independent system operator for grid planning.

✅ Extends retail energy price cap; mitigates volatile gas costs.


The British government said that plans to bolster the country's energy security, diversify away from fossil fuels amid the Europe energy crisis and protect consumers from spiralling prices are set to become law.

Britain's energy security bill will be introduced to Parliament on Wednesday and includes 26 measures to reform the energy system, including ending the gas-electricity price link, and reduce its dependency on fossil fuels and exposure to volatile gas prices.

Global energy prices have skyrocketed this year, and UK natural gas and electricity have risen sharply, particularly after Russia's invasion of Ukraine which has led to many European countries trying to reduce reliance on Russian pipeline gas and seek cheaper alternatives.

The bill will help drive 100 billion pounds ($119 billion) of private sector investment by 2030 into industries to diversify Britain's energy supply, including hydrogen and offshore wind, which could help lower costs as a 16% decrease in bills in April is anticipated, and create around 480,000 jobs by the end of the decade, the government said.

"We’re going to slash red tape, get investment into the UK, and grab as much global market share as possible in new technologies to make this plan a reality," Business and Energy Secretary Kwasi Kwarteng, amid high winter energy costs, said in a statement.

The bill will establish a new independent system operator to coordinate and plan Britain's energy system, while MPs move to restrict prices for gas and electricity through oversight.

It will also enable the extension of a cap on retail energy prices beyond 2023, with the price cap cost under scrutiny, which limits the amount suppliers can charge for each unit of gas and electricity.

The bill will also enable the secretary of state to prevent potential disruptions to the downstream oil sector due to industrial action or malicious protests, the government added.


Related News

View more

Biggest in Canada: Bruce Power doubles PPE donation

Bruce Power PPE Donation supports Canada COVID-19 response, supplying 1.2 million masks, gloves, and gowns to Ontario hospitals, long-term care, and first responders, plus face shields, hand sanitizer, and funding for testing and food banks.


Key Points

Bruce Power PPE Donation is a broad COVID-19 aid delivering PPE, supplies, and funding across Ontario.

✅ 1.2 million masks, gloves, gowns to Ontario care providers

✅ 3-D printed face shields and 50,000 bottles of sanitizer

✅ Funding testing research and supporting regional food banks


The world’s largest nuclear plant, which recently marked an operating record during sustained operations, just made Canada’s largest donation of personal protective equipment (PPE).

Bruce Power is doubling its initial donation of 600,000 masks, gloves and gowns for front-line health workers, to 1.2 million pieces of PPE.

The company, which operates the Bruce Nuclear station near Kincardine, Ont., where a major reactor refurbishment is underway, plans to have the equipment in the hands of hospitals, long-term care homes and first responders by the end of April.

It’s not the only thing Bruce Power is doing to help out Ontario during the COVID-19 pandemic:

 Bruce Power has donated $300,000 to 37 food banks in Midwestern Ontario, highlighting the broader economic benefits of Canadian nuclear projects for communities.

  •  They’re also working with NPX in Kincardine to make face shields with 3-D printers, leveraging local manufacturing contracts to accelerate production.
  •  They’re teaming up with the Power Worker’s Union to fund testing research in Toronto.
  •  They’re working with Three Sheets Brewing and Junction 56 Distillery to distribute 50,000 bottles of hand sanitizer to those that need it.

And that’s all on top of what they’ve been doing for years, producing Cobalt-60, a medical isotope to sterilize medical equipment, and, after a recent output upgrade at the site, producing about 30 per cent of Ontario’s electricity as the province advances the Pickering B refurbishment to bolster grid reliability.

Bruce Power has over 4,000 employees working out of their nuclear plant, on the shores of Lake Huron, as it explores the proposed Bruce C project for potential future capacity.


Related News

View more

Climate change: Greenhouse gas concentrations again break records

Rising Greenhouse Gas Concentrations drive climate change, with CO2, methane, and nitrous oxide surging; WMO data show higher radiative forcing, elevated pre-industrial baselines, and persistent atmospheric concentrations despite Paris Agreement emissions pledges.


Key Points

Increasing atmospheric CO2, methane, and nitrous oxide levels that raise radiative forcing and drive warming.

✅ WMO data show CO2 at 407.8 ppm in 2018, above decade average

✅ Methane and nitrous oxide surged, elevating total radiative forcing

✅ Concentrations differ from emissions; sinks absorb about half


The World Meteorological Organization (WMO) says the increase in CO2 was just above the average rise recorded over the last decade.

Levels of other warming gases, such as methane and nitrous oxide, have also surged by above average amounts.

Since 1990 there's been an increase of 43% in the warming effect on the climate of long lived greenhouse gases.

The WMO report looks at concentrations of warming gases in the atmosphere rather than just emissions.

The difference between the two is that emissions refer to the amount of gases that go up into the atmosphere from the use of fossil fuels, such as burning coal for coal-fired electricity generation and from deforestation.

Concentrations are what's left in the air after a complex series of interactions between the atmosphere, the oceans, the forests and the land. About a quarter of all carbon emissions are absorbed by the seas, and a similar amount by land and trees, while technologies like carbon capture are being explored to remove CO2.

Using data from monitoring stations in the Arctic and all over the world, researchers say that in 2018 concentrations of CO2 reached 407.8 parts per million (ppm), up from 405.5ppm a year previously.

This increase was above the average for the last 10 years and is 147% of the "pre-industrial" level in 1750.

The WMO also records concentrations of other warming gases, including methane and nitrous oxide, and some countries have reported declines in certain potent gases, as noted in US greenhouse gas controls reports, though global levels remain elevated. About 40% of the methane emitted into the air comes from natural sources, such as wetlands, with 60% from human activities, including cattle farming, rice cultivation and landfill dumps.

Methane is now at 259% of the pre-industrial level and the increase seen over the past year was higher than both the previous annual rate and the average over the past 10 years.

Nitrous oxide is emitted from natural and human sources, including from the oceans and from fertiliser-use in farming. According to the WMO, it is now at 123% of the levels that existed in 1750.

Last year's increase in concentrations of the gas, which can also harm the ozone layer, was bigger than the previous 12 months and higher than the average of the past decade.

What concerns scientists is the overall warming impact of all these increasing concentrations. Known as total radiative forcing, this effect has increased by 43% since 1990, and is not showing any indication of stopping.

There is no sign of a slowdown, let alone a decline, in greenhouse gases concentration in the atmosphere despite all the commitments under the Paris agreement on climate change and the ongoing global energy transition efforts," said WMO Secretary-General Petteri Taalas.

"We need to translate the commitments into action and increase the level of ambition for the sake of the future welfare of mankind," he added.

"It is worth recalling that the last time the Earth experienced a comparable concentration of CO2 was three to five million years ago. Back then, the temperature was 2-3C warmer, sea level was 10-20m higher than now," said Mr Taalas.

The UN Environment Programme will report shortly on the gap between what actions countries are taking to cut carbon, for example where Australia's emissions rose 2% recently, and what needs to be done to keep under the temperature targets agreed in the Paris climate pact.

Preliminary findings from this study, published during the UN Secretary General's special climate summit last September, indicated that emissions continued to rise during 2018, although global emissions flatlined in 2019 according to the IEA.

Both reports will help inform delegates from almost 200 countries who will meet in Madrid next week for COP25, following COP24 in Katowice the previous year, the annual round of international climate talks.


Related News

View more

EIA: Pennsylvania exports the most electricity, California imports the most from other states

U.S. Electricity Trade by State, 2013-2017 highlights EIA grid patterns, interstate imports and exports, cross-border flows with Canada and Mexico, net exporters and importers, and market regions like ISOs and RTOs shaping consumption and generation.


Key Points

Brief EIA overview of interstate and cross-border power flows, ranking top net importers and exporters.

✅ Pennsylvania was the largest net exporter, averaging 59 million MWh.

✅ California was the largest net importer, averaging 77 million MWh.

✅ Top cross-border: NY, CA, VT, MN, MI imports; WA, TX, CA, NY, MT exports.


According to the U.S. Energy Information Administration (EIA) State Electricity Profiles, from 2013 to 2017, Pennsylvania was the largest net exporter of electricity, while California was the largest net importer.

Pennsylvania exported an annual average of 59 million megawatt-hours (MWh), while California imported an average of 77 million MWh annually.

Based on the share of total consumption in each state, the District of Columbia, Maryland, Massachusetts, Idaho and Delaware were the five largest power-importing states between 2013 and 2017, highlighting how some clean states import 'dirty' electricity as consumption outpaces local generation. Wyoming, West Virginia, North Dakota, Montana and New Hampshire were the five largest power-exporting states. Wyoming and West Virginia were net power exporting states between 2013 and 2017.

New York, California, Vermont, Minnesota and Michigan imported the most electricity from Canada or Mexico on average from 2013 to 2017, reflecting the U.S. look to Canada for green power during that period. Similarly, Washington, Texas, California, New York, and Montana exported the most electricity to Canada or Mexico, on average, during the same period.

Electricity routinely flows among the Lower 48 states and, to a lesser extent, between the United States and Canada and Mexico. From 2013 to 2017, Pennsylvania was the largest net exporter of electricity, sending an annual average of 59 million megawatthours (MWh) outside the state. California was the largest net importer, receiving an average of 77 million MWh annually.

Based on the share of total consumption within each state, the District of Columbia, Maryland, Massachusetts, Idaho, and Delaware were the five largest power-importing states between 2013 and 2017. Wyoming, West Virginia, North Dakota, Montana, and New Hampshire were the five largest power-exporting states. States with major population centers and relatively less generating capacity within their state boundaries tend to have higher ratios of net electricity imports to total electricity consumption, as utilities devote more to electricity delivery than to power production in many markets.

Wyoming and West Virginia were net power exporting states (they exported more power to other states than they consumed) between 2013 and 2017. Customers residing in these two states are not necessarily at an economic disadvantage or advantage compared with customers in neighboring states when considering their electricity bills and fees and market dynamics. However, large amounts of power trading may affect a state’s revenue derived from power generation.

Some states also import and export electricity outside the United States to Canada or Mexico, even as Canada's electricity exports face trade tensions today. New York, California, Vermont, Minnesota, and Michigan are the five states that imported the most electricity from Canada or Mexico on average from 2013 through 2017. Similarly, Washington, Texas (where electricity production and consumption lead the nation), California, New York, and Montana are the five states that exported the most electricity to Canada or Mexico, on average, for the same period.

Many states within the continental United States fall within integrated market regions, referred to as independent system operators or regional transmission organizations. These integrated market regions allow electricity to flow freely between states or parts of states within their boundaries.

EIA’s State Electricity Profiles provide details about the supply and disposition of electricity for each state, including net trade with other states and international imports and exports, and help you understand where your electricity comes from more clearly.


Related News

View more

NB Power launches public charging network for EVs

NB Power eCharge Network expands EV charging in New Brunswick with fast chargers, level 2 stations, Trans-Canada Highway coverage, and green infrastructure, enabling worry-free electric vehicle travel and lower emissions across the province.


Key Points

NB Power eCharge Network is a provincewide EV charging system with fast and level 2 stations for reliable travel.

✅ 15 fast-charging sites on Trans-Canada and northern New Brunswick

✅ Level 2 stations at highways, municipalities, and businesses

✅ 20-30 minute DC fast charging; cut emissions ~80% and fuel ~75%


NB Power announced Friday the eCharge Network, the province’s first electric vehicle charging network aimed at giving drivers worry-free travel everywhere in the province.

The network includes 15 locations along the province’s busiest highways where both fast-chargers and level-2 chargers will be available. In addition, nine level-2 chargers are already located at participating municipalities and businesses throughout the province. The new locations will be installed by the end of 2017.

NB Power is working with public and private partners to add to the network to enable electric vehicle owners to drive with confidence and to encourage others to make the switch from gas to electric vehicles, supported by a provincial rebate program now available.

“We are incredibly proud to offer our customers and visitors to New Brunswick convenient charging with the launch of our eCharge Network,” said Gaëtan Thomas, president and CEO of NB Power. “Our goal is to make it easy for owners of electric vehicles to drive wherever they choose in New Brunswick, and to encourage more drivers to consider an electric vehicle for their next purchase.”

An electric vehicle owner in New Brunswick can shrink their vehicle carbon footprint by about 80 per cent while reducing their fuel-related costs by about 75 per cent, according to NB Power, and broader grid benefits are being explored through Nova Scotia's vehicle-to-grid pilot across the region.

In addition to the network of standard charging stations, the eCharge network will also include 400 volt fast-charging stations along the Trans-Canada Highway and in the northern parts of New Brunswick. The first of their kind in New Brunswick, these 15 fast-charging stations, similar to Newfoundland and Labrador's newly completed fast-charging network connecting communities, will enable all-electric vehicles to recharge in as little as 20 to 30 minutes. Fast-charge sites will include standard level-2 stations for both battery electric vehicles and plug-in hybrids.

NB Power will install fast-charge and level-2 sites at five locations throughout northern New Brunswick, addressing northern coverage challenges seen elsewhere, such as Labrador's infrastructure gaps today, which will be cost-shared with government. Locations include the areas of Saint-Quentin/Kedgwick, Campbellton, Bathurst, Tracadie, and Miramichi.

“Our government understands that embracing the green economy and reducing our carbon footprint is a priority for New Brunswickers,” said Environment and Local Government Minister Serge Rousselle. “Our climate change action plan calls for a collaborative approach to creating the strategic infrastructure to support electric vehicles throughout all regions in the province, and we are pleased to see this important step underway. New Brunswickers will now have the necessary network to adopt new methods of transportation and contribute to our provincial plan to increase the number of electric vehicles on the road and will help meet emission reduction targets as we work to combat climate change.”

An investment of $500,000 from Natural Resources Canada will go towards purchasing and installing the charging stations for the 10 fast-charging stations along the Trans-Canada Highway.

“The eCharge Network will make it easier for Canadians to choose cleaner options and helps put New Brunswick’s transportation system on a path to a lower-carbon future,” said Moncton-Riverview-Dieppe MP Ginette Petitpas Taylor. “The Government of Canada continues to support green infrastructure in the transportation sector that will advance Canada’s efforts to build a clean economy, create well-paying jobs, and achieve our climate change goals.”

Petitpas Taylor attended for federal Natural Resources Minister Jim Carr.

Fast chargers are being installed at the following locations along the Trans-Canada Highway across New Brunswick:

– Irving Big Stop, Aulac

– Edmundston Truck Stop

– Irving Big Stop, Saint-André

– Johnson Guardian, Perth-Andover

– Murray’s Irving, Woodstock

– Petro-Canada / Acorn Restaurant, Prince William

– Irving Big Stop, Waasis


Related News

View more

Sign Up for Electricity Forum’s Newsletter

Stay informed with our FREE Newsletter — get the latest news, breakthrough technologies, and expert insights, delivered straight to your inbox.

Electricity Today T&D Magazine Subscribe for FREE

Stay informed with the latest T&D policies and technologies.
  • Timely insights from industry experts
  • Practical solutions T&D engineers
  • Free access to every issue

Download the 2025 Electrical Training Catalog

Explore 50+ live, expert-led electrical training courses –

  • Interactive
  • Flexible
  • CEU-cerified