Extreme Heat and Rising Electricity Bills amplify energy costs as climate change drives air conditioning demand, stressing the power grid and energy affordability, with low income households facing outsized burdens during prolonged heat waves.
Key Points
Heat waves from climate change raise AC demand, driving up electricity costs and straining energy affordability.
✅ More AC use spikes electricity demand during heat waves
✅ Low income households face higher energy burden
✅ Grid reliability risks rise with peak cooling loads
Extreme heat waves are not only straining public health systems but also having a significant impact on household finances, particularly through rising electricity bills. According to a recent AP-NORC poll, a growing number of Americans are feeling the financial pinch as soaring temperatures drive up the cost of cooling their homes. This development underscores the broader implications of climate change and its effects on everyday life.
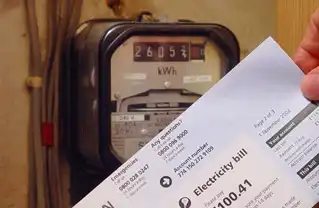
The AP-NORC poll highlights that a majority of Americans are experiencing increased electricity costs as a direct result of extreme heat. As temperatures climb, so does the demand for air conditioning and other cooling systems. This increased energy consumption is contributing to higher utility bills, which can put additional strain on household budgets.
Extreme heat waves have become more frequent and intense due to climate change, which has led to a greater reliance on air conditioning to maintain comfortable indoor environments. Air conditioners and fans work harder during heat waves, and wasteful air conditioning can add around $200 to summer bills, consuming more electricity and consequently driving up energy bills. For many households, particularly those with lower incomes, these increased costs can be a significant burden.
The poll reveals that the impact of rising electricity bills is widespread, affecting a diverse range of Americans. Households across different income levels and geographic regions are feeling the heat, though the extent of the financial strain can vary. Lower-income households are particularly vulnerable, as they often have less flexibility in their budgets to absorb higher utility costs. For these families, the choice between cooling their homes and other essential expenses can be a difficult one.
In addition to financial strain, the poll highlights concerns about energy affordability and access. As electricity bills rise, some Americans may face challenges in paying their bills, leading to potential utility shut-offs or the need to make difficult choices between cooling and other necessities. This situation is exacerbated by the fact that many utility companies do not offer sufficient assistance or relief programs to help low-income households manage their energy costs.
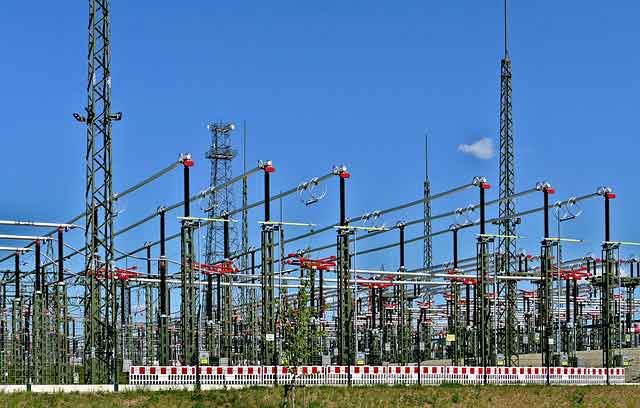
The increasing frequency of extreme heat events and the resulting spike in electricity consumption also have broader implications for the energy infrastructure. Higher demand for electricity can strain power grids, as seen when California narrowly avoided blackouts during extreme heat, potentially leading to outages or reduced reliability. Utilities and energy providers may need to invest in infrastructure upgrades and maintenance to ensure that the grid can handle the increased load during heat waves.
Climate change is a key driver of the rising temperatures that contribute to higher electricity bills. As global temperatures continue to rise, extreme heat events are expected to become more common and severe, and experts warn the US electric grid was not designed to withstand these impacts. This trend underscores the need for comprehensive strategies to address both the causes and consequences of climate change. Efforts to reduce greenhouse gas emissions, improve energy efficiency, and invest in renewable energy sources are critical components of a broader climate action plan.
Energy efficiency measures can play a significant role in mitigating the impact of extreme heat on electricity bills. Upgrading to more efficient cooling systems, improving home insulation, and adopting smart thermostats can help reduce energy consumption and lower utility costs. Additionally, utility companies and government programs can offer incentives and rebates, including ways to tap new funding that help encourage energy-saving practices and support households in managing their energy use.
The poll also suggests that there is a growing awareness among Americans about the connection between climate change and rising energy costs. Many people are becoming more informed about the ways in which extreme weather events and rising temperatures impact their daily lives. This increased awareness can drive demand for policy changes and support for initiatives aimed at addressing climate change and improving energy efficiency, with many willing to contribute income to climate efforts, about the connection between climate change and rising energy costs.
In response to the rising costs and the impact of extreme heat, there are calls for policy interventions and support programs to help manage energy affordability. Proposals include expanding assistance programs for low-income households, investing in infrastructure improvements, and promoting energy efficiency initiatives alongside steps to make electricity systems more resilient to climate risks. By addressing these issues, policymakers can help alleviate the financial burden on households and support a more resilient and sustainable energy system.
Debates over policy impacts on electricity prices continue; in Alberta, federal policies are blamed by some for higher rates, illustrating how regulation can affect affordability.
In conclusion, the AP-NORC poll highlights the growing financial impact of extreme heat on American households, with rising electricity bills being a significant concern for many. The increased demand for cooling during heat waves is straining household budgets and raising broader questions about energy affordability and infrastructure resilience. Addressing these challenges requires a multifaceted approach, including efforts to combat climate change, improve energy efficiency, and provide support for those most affected by rising energy costs. As extreme heat events become more common, finding solutions to manage their impact will be crucial for both individual households and the broader energy system.
Related News