African sun now powers study time

By Reuters


CSA Z463 Electrical Maintenance

Our customized live online or in‑person group training can be delivered to your staff at your location.

  • Live Online
  • 6 hours Instructor-led
  • Group Training Available
Regular Price:
$249
Coupon Price:
$199
Reserve Your Seat Today
Burkina Faso student teacher Hema Cecile has a lot more time to crack the books thanks to a recent initiative from the World Bank and the International Finance Corporation (IFC).

The launch of the Lighting Africa program (www.lightingafrica.org) by the two organizations this year has made it possible for Cecile to swap kerosene lamps for a solar-powered LED lantern.

That means she and a thousand other households in the town of Dedougou - which lies more than 200 km (124 miles) west of the capital Ouagadougou - can extend hours of study, reading or leisure without cutting back on other things.

Cecile lives in the world's second poorest country, where the choice to keep a light on at night means sacrificing resources for necessities such as food, heat, power and shelter.

The LED lights consume almost no power, and can keep shining all night if required. That should mean a more productive, better educated, wealthier population - a virtuous circle of reduced energy use and increased economic activity.

Cecile, 23, is in her final year of teaching studies at the University of Ouagadougou and shares a single room with another student in a three-apartment building.

"There is no electricity, and the drinking water is from the local fountain," she told me in French when we spoke on a mobile phone lent her by a friend.

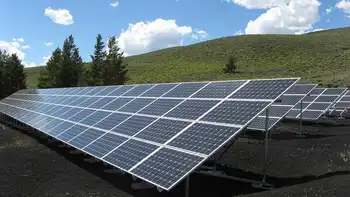
Her only power is from the solar panel built into her lantern, which she bought for a subsidized price of $20.

Lighting Africa is a $12 million project which intends to bring light to the poorest regions across sub-Saharan Africa. The program works with the lighting industry to develop clean, affordable lighting and energy solutions for millions without access to electric grids.

Its aim is to accelerate the market and to develop education programs that inform off-grid populations currently dependent on costly, inefficient and hazardous fuel-based lighting about modern alternatives.

Cecile used to spend $3-4 a month on kerosene for her lamp. That is a large proportion of her earnings - like 70 percent of the population she lives on less than $2 a day.

"I can work later at night - its good for my studies; I can read a book," said Cecile.

In the weeks since buying her lantern she has managed to read four books including Madame Bovary by Gustave Flaubert and Emile Zola's Germinal.

She is among the most learned in a society which has the world's lowest literacy rate, according to a 2007 UN Human Development Report. When she graduates next year she will teach in a local Junior school.

She makes ends meet by holiday jobs as a cleaner and an IT trainer. To earn her daily ration of cornmeal she does shifts from May to September in a corn field.

Her solar lantern is made and distributed by CB Energie which won an open competition to be awarded the contract.

"We have just started to make these lanterns in Burkina Faso and sold about 3,000 so far," said Arnaud Chabanne a French engineer who founded the company.

The lanterns are designed to look like the kerosene ones they are replacing in order to increase adoption among the population. Each has a small solar panel on the top and costs an average $30, although some cost $100, depending on the size of the battery and the number of LED lights it contains.

Because of the large number of sunlight hours in Burkina Faso, the lamps can be relied on to work whenever needed. The battery life is 2-4 years, and can be replaced once they lose their storage capacity. The LED lights last 5-10 years.

Cecile had tried another solar lantern before she was given one by CB Energie, but "it did not last long each night' she said.

CB Energie has distributed the lanterns to about seven percent of the Dedougou area's 15,000 households, and will continue until every needy household has one.

"Petrol is expensive," said Chabanne, "so they can take this money for other things like food, or medicine."

Although it is barely out of its trial period the project, Chabanne said there are signs the project is a boon for the population in areas other than household savings and education. "There are fewer people reporting eye problems to the local hospital."

Related News

USA: 3 Ways Fossil Energy Ensures U.S. Energy Security

DOE Office of Fossil Energy safeguards energy security via the Strategic Petroleum Reserve, domestic critical minerals from coal byproducts, and carbon capture to curb CO2, strengthening resiliency amid shocks and supporting U.S. manufacturing and defense.


Key Points

A DOE program advancing energy security through SPR stewardship, critical minerals R&D, and carbon capture.

✅ Manages the Strategic Petroleum Reserve for emergency crude supply

✅ Develops domestic critical minerals from coal and mining byproducts

✅ Deploys carbon capture, utilization, and storage to cut CO2


The global economy has just experienced a period of unique transformation because of COVID-19. The fact that remains constant in this new economic landscape is that our society relies on energy; it’s an integral part of our day-to-day lives, even as U.S. energy use has evolved over time. According to the U.S. Energy Information Administration, approximately 80 percent of energy consumption in the United States comes from fossil fuels, so having access to a secure and reliable supply of those energy resources is more important than ever for national energy security considerations today. Below are three examples that highlight how our work at the U.S. Department of Energy’s Office of Fossil Energy (FE) helps ensure the Nation’s energy security and resiliency.

(1) Open crude oil reserves to respond to crises

FE has overall program responsibility for carrying out the mission of the Strategic Petroleum Reserve (SPR), the world’s largest supply of emergency crude oil. These federally-owned stocks are stored in massive underground salt caverns along the coastline of the Gulf of Mexico. The SPR is a powerful tool U.S. leaders use to respond to a wide range of crises, including energy crisis impacts on electricity and fuels, involving crude oil disruption or demand loss.  When the COVID-19 pandemic hit, the oil markets crashed and crude oil demand dropped drastically across the world. U.S. oil producers turned to the SPR to store their oil while broader energy dominance constraints were becoming evident in practice. This helped alleviate the pressure on producers to shut in oil production and proved to be a critical asset for American energy and national security.

(2) Use the Nation’s abundant coal reserves to produce valuable materials

Critical materials, including rare earth elements, are a group of chemical elements and materials with unique properties that support manufacturing of most modern technologies. They are essential components for critical defense and homeland security applications, green energy technologies, hybrid and electric vehicles, and high-value electronics. While these materials are not rare, they are hard to separate and expensive to extract. The United States relies heavily on imports from China. To reduce U.S. dependence on foreign sources, FE has a research and development program aimed at producing a domestic supply of critical materials from the Nation’s abundant coal resources and associated byproducts from legacy and current mining operations. Many of the technologies being developed can also be used to separate critical minerals from other mining materials and byproducts. Tapping into these resources has the potential to create new industries and revitalize coal communities and the workforce in coal-producing regions.

(3) Decrease carbon emissions for a cleaner energy future

FE is committed to balancing the Nation’s energy use with the need to protect the environment, and has a comprehensive portfolio of technological solutions that help keep carbon dioxide (CO2) emissions out of the atmosphere. For example, amid high natural gas prices that reinforce the case for clean electricity, the Department has been investing in carbon capture, utilization, and storage technologies for over a decade. These technologies capture CO2 emissions from various sources, including coal-fired power plants and manufacturing plants, before they enter the atmosphere. Several of these cutting-edge technologies have been deployed at major demonstration sites, supported by clean energy funding that aims to benefit millions. Three of these projects—Petra Nova, Archer Daniels Midland, and Air Products & Chemicals—have captured and injected over 10.8 million metric tons of CO2. The success of these projects is paving the way toward a cleaner and more sustainable American energy future.


Related News

View more

In a record year for clean energy purchases, Southeast cities stand out

Municipal Renewable Energy Procurement surged as cities contracted 3.7 GW of solar and wind, leveraging green tariffs, community solar, and utility partnerships across the Southeast, led by Houston, RMI, and WRI data.


Key Points

The process by which cities contract solar and wind via utilities or green tariffs to meet climate goals.

✅ 3.7 GW procured in 2020, nearly 25% year-over-year growth

✅ Houston runs city ops on 500 MW solar, a record purchase

✅ Southeast cities use green tariffs and community solar


Cities around the country bought more renewable energy last year than ever before, reflecting how renewables may soon provide one-fourth of U.S. electricity across the grid, with some of the most remarkable projects in the Southeast, according to new data unveiled Thursday.

Even amid the pandemic, about eight dozen municipalities contracted to buy nearly 3.7 gigawatts of mostly solar and wind energy — enough to power more than 800,000 homes. The figure is almost a quarter higher than the year before.

Half of the cites listed as “most noteworthy” in Thursday’s release —  from research groups Rocky Mountain Institute and World Resources Institute — are in the region that stretches from Texas to Washington, D.C. 

Houston stands out for the sheer enormity of its purchase: In July, it began powering city operations entirely from nearly 500 megawatts of solar power — the largest municipal purchase of renewable energy ever in the United States, as renewable electricity surpassed coal nationwide.

The groups also feature smaller deals in North Carolina and Tennessee, achieved through a utility partnership called a green tariff.

“We wanted to recognize that Nashville and Charlotte were really blazing a new trail,” said Stephen Abbott, principal at the Rocky Mountain Institute.

And the nation’s capital shows how renewable energy can be a source of revenue: It’s leasing out its public transit station rooftops for 10 megawatts of community solar.

All of these strategies will be necessary for scores of U.S. cities to meet their ambitious climate goals, researchers believe. An interactive clean energy targets tracker shows all 95 clean energy procurements from the year in detail.


Tracker 
Even before former President Donald Trump promised to remove the United States from the Paris Climate Accord, a lack of federal action on climate left a void that some cities and counties were beginning to fill, as renewables hit a record 28% in a recent month. In 2015, the first year tracked by researchers at the Rocky Mountain Institute and the World Resources Institute, municipalities contracted to buy more than 1 gigawatt of wind, solar and other forms of clean energy. 

But when Trump officially set in motion the withdrawal from the climate agreement, the ranks of municipalities dedicated to 100% clean energy multiplied. Today there are nearly 200 of them. The growth in activity last year reflects, in part, that surge of new pledges.

“It takes a while to get city staff up to speed and understand the options, and create the roadmap and then start executing,” Abbott said. “There is a bit of a lag, but we’re starting to see the impact.”

Even in Houston — one of the earliest to begin procuring renewable energy — there has been a steep learning curve as market forces change and prices drop, including cheaper solar batteries shaping procurement strategies, said Lara Cottingham, Houston’s chief of staff and chief sustainability officer.

No matter how well resourced and educated their staff, cities have to clear a thicket of structural, political and economic challenges to procure renewable energy. Most don’t own their own sources of power. Nearly all face budget constraints. Few have enough land or government rooftops to meet their goals within city limits.

“Cities face a situation where it’s a square peg in a round hole,” Cottingham said.

The hurdles are especially steep in much of the Southeast, where only publicly regulated utilities can sell electricity to retail customers, even large ones such as major cities. That’s where a green tariff regime comes in: Cities can purchase clean energy from a third party, such as a solar company, using the utility as a go-between.

Early last year, Charlotte became the largest city to use such a program, partnering with Duke Energy and two North Carolina solar developers to build a solar farm 50 miles north in Iredell County. At first, the city will pay a premium for the energy, but in the latter half of the 20-year contract, as gas prices rise, it will save money compared to business as usual.

“Over the course of 20 years, it’s projected we would save about $2 million,” Katie Riddle, sustainability analyst with Charlotte, told the Energy News Network last year.

The growing size of projects, innovative partnerships like green tariff programs, and the improving economics all give Abbott hope that renewable energy investments from cities will only grow — even with the Trump presidency over and the country back in the Paris agreement.

And when cities meet their goals for procuring renewable energy for their own operations, they must then turn to an even bigger task: reducing the carbon footprint of every person in their jurisdiction with broader decarbonization strategies and community engagement.

“The city needs to do its part for sure,” said Houston’s Cottingham. “Then we have this challenge of how do we get everyone else to.”


Related News

View more

Spent fuel removal at Fukushima nuclear plant delayed up to 5 years

Fukushima Daiichi decommissioning delay highlights TEPCO's revised timeline, spent fuel removal at Units 1 and 2, safety enclosures, decontamination, fuel debris extraction by robot arm, and contaminated water management under stricter radiation control.


Key Points

A government revised schedule pushing back spent fuel removal and decommissioning milestones at Fukushima Daiichi.

✅ TEPCO delays spent fuel removal at Units 1 and 2 for safety.

✅ Enclosures, decontamination, and robotics mitigate radioactive risk.

✅ Contaminated water cut target: 170 tons/day to 100 by 2025.


The Japanese government decided Friday to delay the removal of spent fuel from the Fukushima Daiichi nuclear power plant's Nos. 1 and 2 reactors by as much as five years, casting doubt on whether it can stick to its timeframe for dismantling the crippled complex.

The process of removing the spent fuel from the units' pools had previously been scheduled to begin in the year through March 2024.

In its latest decommissioning plan, the government said the plant's operator, Tokyo Electric Power Company Holdings Inc., will not begin the roughly two-year process (a timeline comparable to major reactor refurbishment programs seen worldwide) at the No. 1 unit at least until the year through March 2028 and may wait until the year through March 2029.

Work at the No. 2 unit is now slated to start between the year through March 2025 and the year through March 2027, it said.

The delay is necessary to take further safety precautions such as the construction of an enclosure around the No. 1 unit to prevent the spread of radioactive dust, and decontamination of the No. 2 unit, even as authorities have begun reopening previously off-limits towns nearby, the government said. It is the fourth time it has revised its schedule for removing the spent fuel rods.

"It's a very difficult process and it's hard to know what to expect. The most important thing is the safety of the workers and the surrounding area," industry minister Hiroshi Kajiyama told a press conference.

The government set a new goal of finishing the removal of the 4,741 spent fuel rods across all six of the plant's reactors by the year through March 2032, amid ongoing debates about the consequences of early nuclear plant closures elsewhere.

Plant operator TEPCO has started the process at the No. 3 unit and already finished at the No. 4 unit, which was off-line for regular maintenance at the time of the disaster. A schedule has yet to be set for the Nos. 5 and 6 reactors.

While the government maintained its overarching timeframe of finishing the decommissioning of the plant 30 to 40 years from the 2011 crisis triggered by a magnitude 9.0 earthquake and tsunami, there may be further delays, even as milestones at other nuclear projects are being reached worldwide.

The government said it will begin removing fuel debris from the three reactors that experienced core meltdowns in the year through March 2022, starting with the No. 2 unit as part of broader reactor decommissioning efforts.

The process, considered the most difficult part of the decommissioning plan, will involve using a robot arm, reflecting progress in advanced reactors technologies, to initially remove small amounts of debris, moving up to larger amounts.

The government also said it will aim to reduce the pace at which contaminated water at the plant increases. Water for cooling the melted cores, mixed with underground water, amounts to around 170 tons a day. That number will be brought down to 100 tons by 2025, it said.

The water is being treated to remove the most radioactive materials and stored in tanks on the plant's grounds, but already more than 1 million tons has been collected and space is expected to run out by the summer of 2022.


Related News

View more

WY Utility's First Wind Farm Faces Replacement

Foote Creek I Wind Farm Repowering upgrades Wyoming turbines with new nacelles, towers, and blades, cutting 68 units to 12 while sustaining 41.6 MW, under PacifiCorp and Rocky Mountain Power's Energy Vision 2020 plan.


Key Points

Replacement at Foote Creek Rim I, cutting to 12 turbines while sustaining about 41.6 MW using modern 2-4.2 MW units.

✅ 12 turbines replace 68, output steady near 41.6 MW

✅ New nacelles, towers, blades; taller 500 ft turbines

✅ Part of PacifiCorp Energy Vision 2020 and Gateway West


A Wyoming utility company has filed a permit to replace its first wind farm—originally commissioned in 1998, composed of over 65 turbines—amid new gas capacity competing with nuclear in Ohio, located at Foote Creek Rim I. The replacement would downsize the number of turbines to 12, which would still generate roughly the same energy output.

According to the Star Tribune, PacifiCorp’s new installation would involve new nacelles, new towers and new blades. The permit was filed with Carbon County.


New WY Wind Farm

The replacement wind turbines will stand more than twice as tall as the old: Those currently installed stand 200 feet tall, whereas their replacements will tower closer to 500 feet. Though this move is part of the company’s overall plan to expand its state wind fleet as some utilities respond to declining coal returns in the Midwest, the work going into the Foote Creek site is somewhat special, noted David Eskelsen, spokesperson for Rocky Mountain Power, the western arm of PacifiCorp.

“Foote Creek I repowering is somewhat different from the repowering projects announced in the (Energy Vision) 2020 initiative,” he said. “Foote Creek is a complete replacement of the existing 68 foundations, towers, turbine nacelles and rotors (blades).”

Currently, the turbines at Foote Creek have 600 kilowatts capacity each; the replacements’ maximum production ranges from 2 megawatts to 4.2 megawatts each, with the total output remaining steady at 41.4 megawatts, a scale similar to a 30-megawatt wind expansion in Eastern Kings, though there will be a slight capacity increase to 41.6 megawatts, according to the Star Tribune.

As part of the wind farm repowering initiative, PacifiCorp is to become full owner and operator of the Foote Creek site. When the farm was originally built, an Oregon-based water and electric board was 21 percent owner; 37 percent of the project’s output was tied into a contract with the Bonneville Power Administration.

Otherwise, PacifiCorp is moving to further expand its state wind fleet in line with initiatives like doubling renewable electricity by 2030 in Saskatchewan, with the addition of three new wind farms—to be located in Carbon, Albany and Converse counties—which may add up to 1,150 megawatts of power.

According to PacifiCorp, the company has more than 1,000 megawatts of owned wind generation capability, along with long-term purchase agreements for more than 600 megawatts from other wind farms owned by other entities. Energy Vision 2020 refers to a $3.5 billion investment and company move that is looking to upgrade the company's existing wind fleet with newer technology, adding 1,150 megawatts of new wind resources by 2020 and a a new 140-mile Gateway West transmission segment in Wyoming, comparable to a transmission project in Missouri just energized.


Related News

View more

27 giant parts from China to be transported to wind farm in Saskatchewan

Port of Vancouver Wind Turbine Blades arrive from China for a Saskatchewan wind farm, showcasing record oversized cargo logistics, tandem crane handling, renewable energy capacity, and North America's longest blades from Goldwind.


Key Points

Record-length blades for a Canadian wind farm, boosting renewable energy and requiring heavy-lift logistics at the port.

✅ 27 blades unloaded via tandem cranes with cage supports

✅ 50 turbines headed to Assiniboia over 21 weeks

✅ Largest 250 ft blades to arrive; reduced CO2 vs coal


A set of 220-foot-long wind turbine blades arrived at the Port of Vancouver from China over the weekend as part a shipment bound for a wind farm in Canada, alongside BC generating stations coming online in the region.

They’re the largest blades ever handled by the port, and this summer, even larger blades will arrive as companies expand production such as GE’s blade factory in France to meet demand — the largest North America has ever seen.

Alex Strogen described the scene as crews used two tandem cranes to unload 27 giant white blades from the MV Star Kilimanjaro, which picked up the wind turbine assemblies in China. They were manufactured by Goldwind Co.

“When you see these things come off and put onto these trailers, it’s exceptional in the sheer length of them,” Strogen said. “It looks as long as an airplane.”

In fact, each blade is about as long as the wingspan of a Boeing 747.

Groups of longshoremen attached the cranes to each blade and hoisted it into the air and onto a waiting truck. Metal cage-like devices on both ends kept the blades from touching the ground. Once loaded onto the trucks, the blades and shaft parts head to a terminal to be unloaded by another group of workers.

Another fleet of trucks will drive the wind turbines, towers and blades to Assiniboia, Saskatchewan, Canada, over the course of 21 weeks. Potentia Renewables of Toronto is erecting the turbines on 34,000 acres of leased agriculture land, amid wind farm expansion in PEI elsewhere in the country, according to a news release from the Port of Vancouver.

Potentia’s project, called the Golden South Wind Project, will generate approximately 900,000 megawatt-hours of electricity. It also has greatly reduced CO2 emissions compared with a coal-fired plant, and complements tidal power in Nova Scotia in Canada’s clean energy mix, according to the news release.

The project is expected to be operating in 2021, similar to major UK offshore wind additions coming online.

The Port of Vancouver will receive 50 full turbines of two models for the project, as Manitoba invests in new turbines across Canada. In August, the larger of the models, with blades measuring 250 feet, will arrive. They’ll be the longest blades ever imported into any port in North America.

“It’s an exciting year for the port,” said Ryan Hart, chief external affairs officer.

The Port of Vancouver is following all the recommended safety precautions during the COVID-19 pandemic, including social distancing and face masks, Strogen said, with support from initiatives like Bruce Power’s PPE donation across Canada.
As for crews onboard the ships, the U.S. Coast Guard is the agency in charge, and it is monitoring the last port-of-call for all vessels seeking to enter the Columbia River, Hart wrote in an email.

Vessel masters on each ship are responsible for monitoring the health of the crew and are required to report sick or ill crew members to the USCG prior to arrival or face fines and potential arrest.


Related News

View more

Four Facts about Covid and U.S. Electricity Consumption

COVID-19 Impact on U.S. Electricity Consumption shows commercial and industrial demand dropped as residential use rose, with flattened peak loads, weekday-weekend convergence, Texas hourly data, and energy demand as a real-time economic indicator.


Key Points

It reduced commercial and industrial demand while raising residential use, shifting peaks and weekday patterns.

✅ Commercial electricity down 12%; industrial down 14% in Q2 2020

✅ Residential use up 10% amid work-from-home and lockdowns

✅ Peaks flattened; weekday-weekend loads converged in Texas


This is an important turning point for the United States. We have a long road ahead. But one of the reasons I’m optimistic about Biden-Harris is that we will once again have an administration that believes in science.

To embrace this return to science, I want to write today about a fascinating new working paper by Tufts economist Steve Cicala.

Professor Cicala has been studying the effect of Covid on electricity consumption since back in March, when the Wall Street Journal picked up his work documenting an 18% decrease in electricity consumption in Italy.

The new work, focused on the United States, is particularly compelling because it uses data that allows him to distinguish between residential, commercial, and industrial sectors, against a backdrop of declining U.S. electricity sales over recent years.

Without further ado, here are four facts he uncovers about Covid and U.S. electricity demand during COVID-19 and consumption.


Fact #1: Firms Are Using Less
U.S. commercial electricity consumption fell 12% during the second quarter of 2020. U.S. industrial electricity consumption fell 14% over the same period.

This makes sense. The second quarter was by some measures, the worst quarter for the U.S. economy in over 145 years!

Economic activity shrank. Schools closed. Offices closed. Factories closed. Restaurants closed. Malls closed. Even health care offices closed as patients delayed going to the dentist and other routine care. All this means less heating and cooling, less lighting, less refrigeration, less power for computers and other office equipment, less everything.

The decrease in the industrial sector is a little more surprising. My impression had been that the industrial sector had not fallen as far as commercial, but amid broader disruptions in coal and nuclear power that strained parts of the energy economy, the patterns for both sectors are quite similar with the decline peaking in May and then partially rebounding by July. The paper also shows that areas with higher unemployment rates experienced larger declines in both sectors.


Fact #2: Households Are Using More
While firms are using less, households are using more. U.S. residential electricity consumption increased 10% during the second quarter of 2020. Consumption surged during March, April, and May, a reflection of the lockdown lifestyle many adopted, and then leveled off in June and July – with much less of the rebound observed on the commercial/industrial side.

This pattern makes sense, too. In Professor Cicala’s words, “people are spending an inordinate amount of time at home”. Many of us switched over to working from home almost immediately, and haven’t looked back. This means more air conditioning, more running the dishwasher, more CNN (especially last week), more Zoom, and so on.

The paper also examines the correlates of the decline. Areas in the U.S. where more people can work from home experienced larger increases. Unemployment rates, however, are almost completely uncorrelated with the increase.


Fact #3: Firms are Less Peaky
The paper next turns to a novel dataset from Texas, where Texas grid reliability is under active discussion, that makes it possible to measure hourly electricity consumption by sector.

As the figure above illustrates, the biggest declines in commercial/industrial electricity consumption have occurred Monday through Friday between 9AM and 5PM.

The dashed line shows the pattern during 2019. Notice the large spikes in electricity consumption during business hours. The solid line shows the pattern during 2020. Much smaller spikes during business hours.


Fact #4: Everyday is Like Sunday
Finally, we have what I would like to nominate as the “Energy Figure of the Year”.

Again, start with the pattern for 2019, reflected by the dashed line. Prior to Covid, Texas households used a lot more electricity on Saturdays and Sundays.

Then along comes Covid, and turned every day into the weekend. Residential electricity consumption in Texas during business hours Monday-Friday is up 16%(!).

In the pattern for 2020, it isn’t easy to distinguish weekends from weekdays. If you feel like weekdays and weekends are becoming a big blur – you are not alone.


Conclusion
Researchers are increasingly thinking about electricity consumption as a real-time indicator of economic activity, even as flat electricity demand complicates utility planning and investment. This is an intriguing idea, but Professor Cicala’s new paper shows that it is important to look sector-by-sector.

While commercial and industrial consumption indeed seem to measure the strength of an economy, residential consumption has been sharply countercylical – increasing exactly when people are not at work and not at school.

These large changes in behavior are specific to the pandemic. Still, with the increased blurring of home and non-home activities we may look back on 2020 as a key turning point in how we think about these three sectors of the economy.

More broadly, Professor Cicala’s paper highlights the value of social science research. We need facts, data, and yes, science, if we are to understand the economy and craft effective policies on energy insecurity and shut-offs as well.


Related News

View more

Sign Up for Electricity Forum’s Newsletter

Stay informed with our FREE Newsletter — get the latest news, breakthrough technologies, and expert insights, delivered straight to your inbox.

Electricity Today T&D Magazine Subscribe for FREE

Stay informed with the latest T&D policies and technologies.
  • Timely insights from industry experts
  • Practical solutions T&D engineers
  • Free access to every issue

Download the 2025 Electrical Training Catalog

Explore 50+ live, expert-led electrical training courses –

  • Interactive
  • Flexible
  • CEU-cerified