California Rolling Blackouts expose grid reliability risks amid a heatwave, as CAISO curtails power while solar output fades at sunset, wind stalls, and scarce natural gas and nuclear capacity plus PG&E issues strain imports.
Key Points
Grid outages during heatwaves from low reserves, fading solar, weak wind, and limited firm capacity.
✅ Heatwave demand rose as solar output dropped at sunset
✅ Limited imports and gas, nuclear shortfalls cut reserves
✅ Policy, pricing, and maintenance gaps increased outage risk
Millions of Californians were denied electrical power and thus air conditioning during a heatwave, raising the risk of heatstroke and death, particularly among the elderly and sick.
The blackouts come at a time when people, particularly the elderly, are forced to remain indoors due to Covid-19, and as later heat waves would test the grid again statewide.
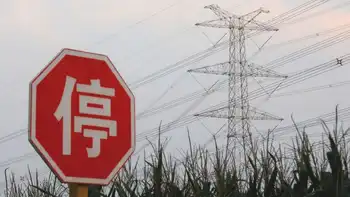
At first, the state’s electrical grid operator last night asked customers to voluntarily reduce electricity use. But after lapses in power supply pushed reserves to dangerous levels it declared a “Stage 3 emergency” cutting off power to people across the state at 6:30 pm.
The immediate reason for the black-outs was the failure of a 500-megawatt power plant and an out-of-service 750-megawatt unit not being available. “There is nothing nefarious going on here,” said a spokeswoman for California Independent System Operator (CAISO). “We are just trying to run the grid.”
But the underlying reasons that California is experiencing rolling black-outs for the second time in less than a year stem from the state’s climate policies, which California policymakers have justified as necessary to prevent deaths from heatwaves, and which it is increasingly exporting to Western states as a model.
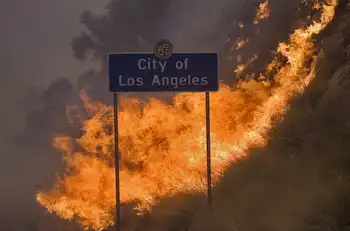
In October, Pacific Gas and Electric cut off power to homes across California to avoid starting forest fires after reports that its power lines may have started fires in recent seasons. The utility and California’s leaders had over the previous decade diverted billions meant for grid maintenance to renewables.
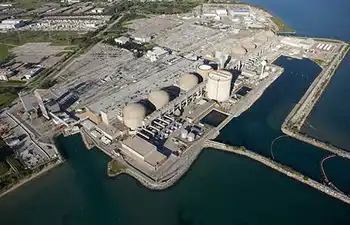
And yesterday, California had to impose rolling blackouts because it had failed to maintain sufficient reliable power from natural gas and nuclear plants, or pay in advance for enough guaranteed electricity imports from other states.
It may be that California’s utilities and their regulator, the California Public Utilities Commission, which is also controlled by Gov. Newsom, didn’t want to spend the extra money to guarantee the additional electricity out of fears of raising California’s electricity prices even more than they had already raised them.
California saw its electricity prices rise six times more than the rest of the United States from 2011 to 2019, helping explain why electricity prices are soaring across the state, due to its huge expansion of renewables. Republicans in the U.S. Congress point to that massive increase to challenge justifications by Democrats to spend $2 trillion on renewables in the name of climate change.
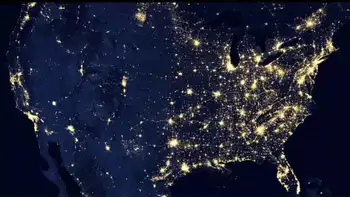
Even though the cost of solar panels declined dramatically between 2011 and 2019, their unreliable and weather-dependent nature meant that they imposed large new costs in the form of storage and transmission to keep electricity as reliable. California’s solar panels and farms were all turning off as the blackouts began, with no help available from the states to the East already in nightfall.
Electricity from solar goes away at the very moment when the demand for electricity rises. “The peak demand was steady in late hours,” said the spokesperson for CAISO, which is controlled by Gov. Gavin Newsom, “and we had thousands of megawatts of solar reducing their output as the sunset.”
The two blackouts in less than a year are strong evidence that the tens of billions that Californians have spent on renewables come with high human, economic, and environmental costs.
Last December, a report by done for PG&E concluded that the utility’s customers could see blackouts double over the next 15 years and quadruple over the next 30.
California’s anti-nuclear policies also contributed to the blackouts. In 2013, Gov. Jerry Brown forced a nuclear power plant, San Onofre, in southern California to close.
Had San Onofre still been operating, there almost certainly would not have been blackouts on Friday as the reserve margin would have been significantly larger. The capacity of San Onofre was double that of the lost generation capacity that triggered the blackout.
California's current and former large nuclear plants are located on the coast, which allows for their electricity to travel shorter distances, and through less-constrained transmission lines than the state’s industrial solar farms, to get to the coastal cities where electricity is in highest demand.
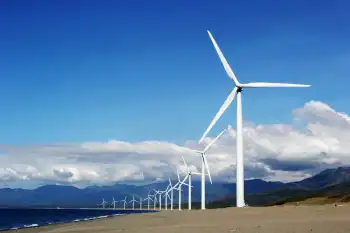
There has been very little electricity from wind during the summer heatwave in California and the broader western U.S., further driving up demand. In fact, the same weather pattern, a stable high-pressure bubble, is the cause of heatwaves, since it brought very low wind for days on end along with very high temperatures.
Things won’t be any better, and may be worse, in the winter, with a looming shortage as it produces far less solar electricity than the summer. Solar plus storage, an expensive attempt to fix problems like what led to this blackout, cannot help through long winters of low output.
California’s electricity prices will continue to rise if it continues to add more renewables to its grid, and goes forward with plans to shut down its last nuclear plant, Diablo Canyon, in 2025.
Had California spent an estimated $100 billion on nuclear instead of on wind and solar, it would have had enough energy to replace all fossil fuels in its in-state electricity mix.
To manage the increasingly unreliable grid, California will either need to keep its nuclear plant operating, build more natural gas plants, underscoring its reliance on fossil fuels for reliability, or pay ever more money annually to reserve emergency electricity supplies from its neighbors.
After the blackouts last October, Gov. Newsom attacked PG&E Corp. for “greed and mismanagement” and named a top aide, Ana Matosantos, to be his “energy czar.”
“This is not the new normal, and this does not take 10 years to solve,” Newsom said. “The entire system needs to be reimagined.”
Related News