California Wildfire Power Shut-Offs escalate as PG&E imposes blackouts amid high winds, Getty and Kincade fires, mass evacuations, Sonoma County threats, and a state of emergency, drawing regulatory scrutiny over grid safety and outage scope.
Key Points
Planned utility outages to curb wildfire risk during extreme winds, prompting evacuations and regulatory scrutiny.
✅ PG&E preemptive blackouts under regulator inquiry
✅ Getty and Kincade fires drive mass evacuations
✅ Sonoma County under threat amid high winds
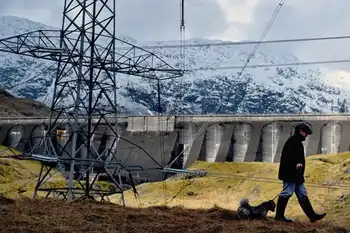
Pacific Gas & Electric (PG&E) already faces an investigation by regulators after cutting supplies to 970,000 homes and businesses amid California blackouts that raised concerns.
It announced that another 650,000 properties would face precautionary shut-offs.
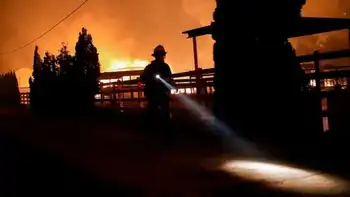
Wildfires fanned by the strong winds are raging in two parts of the state.
Thousands of residents near the wealthy Brentwood neighbourhood of Los Angeles have been told to evacuate because of a wildfire that began early on Monday.
Further north in Sonoma County, a larger fire has forced 180,000 people from their homes.
California's governor has declared a state-wide emergency.
What about the power cuts?
On Monday regulators announced a formal inquiry into whether energy utilities broke rules by pre-emptively cutting power to an estimated 2.5 million people, amid a blackouts policy debate that intensified, as wildfire risks soared.
They did not name any utilities but analysts said PG&E was responsible for the bulk of the "public safety power shut-offs", and later faced a Camp Fire guilty plea that underscored its liabilities.
The company filed for bankruptcy in January after facing hundreds of lawsuits from victims of wildfires in 2017 and 2018.
Of the 970,000 properties hit by the most recent cuts, under half had their services back by Monday, and some sought help through wildfire assistance programs, the Associated Press reported.
Despite criticism that the precautionary blackouts were too widespread and too disruptive, PG&E said more would come on Tuesday and Wednesday because further strong winds were expected.
The company said it had logged more than 20 preliminary reports of damage to its network from the most recent windstorm.
In a video posted to Twitter on Saturday, Governor Gavin Newsom said the power cuts were "infuriating everyone, and rightfully so".
Where are the fires now?
In Los Angeles, the Getty Fire has burned over 600 acres (242 ha) and about 10,000 buildings are in the mandatory evacuation zone.
At least eight homes have been destroyed and five others damaged.
"If you are in an evacuation zone, don't screw around," Mr Schwarzenegger tweeted. "Get out."
LA fire chief Ralph Terrazas said fire crews had been "overwhelmed" by the scale of the fires.
"They had to make some tough decisions on which houses they were able to protect," he said.
"Many times it depends on where the ember lands. I saw homes that were adjacent to homes that were totally destroyed, without any damage."
In northern California, schools remain closed in Sonoma County, where tens of thousands of homes and businesses are under threat.
Sonoma has been ravaged by the Kincade Fire, which started on Wednesday and has burned through 50,000 acres of land, fanned by the winds.
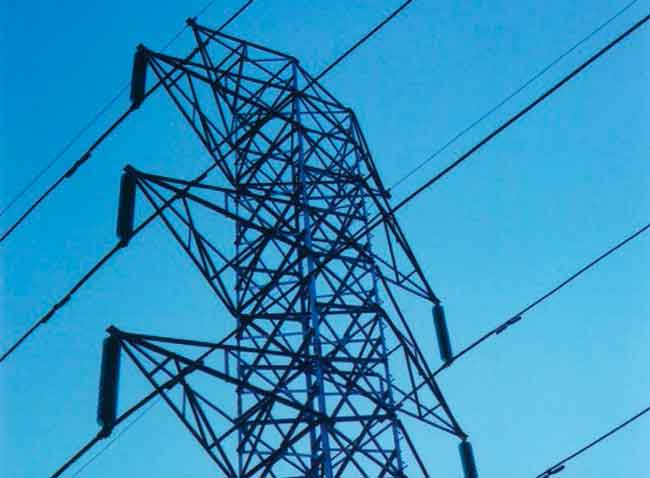
The Kincade Fire began seven minutes after a nearby power line was damaged, and power lines may have started fires according to reports, but PG&E has not yet confirmed if the power glitch started the blaze.
About 180,000 people have been ordered to evacuate, with roads around Santa Rosa north of San Francisco packed with cars as people tried to flee.
There are fears the flames could cross the 101 highway and enter areas that have not seen wildfires since the 1940s.
Related News