Clean Power Plan Rollback signals EPA's shift to inside-the-fence efficiency at coal plants, emphasizing heat-rate improvements over sector-wide decarbonization, renewables, natural gas switching, demand-side efficiency, and carbon capture under Clean Air Act constraints.
Key Points
A policy shift by the EPA to replace broad emissions rules with plant-level efficiency standards, limiting CO2 cuts.
✅ Inside-the-fence heat-rate improvements at coal units
✅ Potential CO2 cuts limited to about 6% per plant
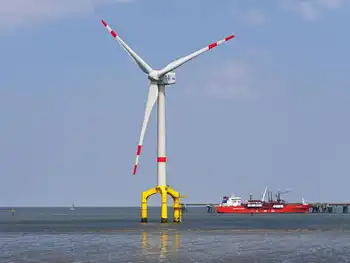
✅ Alternatives: fuel switching, renewables, carbon capture
President Barack Obama’s signature plan to reduce carbon dioxide emissions from electrical generation took years to develop and touched every aspect of power production and use, from smokestacks to home insulation.
The Trump administration is moving to scrap that plan and has signaled that any alternative it might adopt would take a much less expansive approach, possibly just telling utilities to operate their plants more efficiently.
That’s a strategy environmentalists say is almost certain to fall short of what’s needed.
The Trump administration is making "a wholesale retreat from EPA’s legal, scientific and moral obligation to address the threats of climate change," said former Environmental Protection Agency head Gina McCarthy, the architect of Obama’s Clean Power Plan.
President Donald Trump promised to rip up the initiative, echoing an end to the 'war on coal' message from his campaign, which mandated that states change their overall power mix, displacing coal-fired electricity with that from wind, solar and natural gas. The EPA is about to make it official, arguing the prior administration violated the Clean Air Act by requiring those broad changes to the electricity sector, according to a draft obtained by Bloomberg.
Possible Replacements
Later, the agency will also ask the public to weigh in on possible replacements. The administration will ask whether the EPA can or should develop a replacement rule -- and, if so, what actions can be mandated at individual power plants, though some policymakers favor a clean electricity standard to drive broader decarbonization.
Follow the Trump Administration’s Every Move
Such changes -- such as adding automation or replacing worn turbine seals -- would yield at most a 6 percent gain in efficiency, along with a corresponding fall in greenhouse gas emissions, according to earlier modeling by the Environmental Protection Agency and other analysts. That compares to the 32 percent drop in emissions by 2030 under Obama’s Clean Power Plan.
"In these existing plants, there’s only so many places to look for savings," said John Larsen, a director of the Rhodium Group, a research firm. "There’s only so many opportunities within a big spinning machine like that."
EPA Administrator Scott Pruitt outlined such an "inside-the-fence-line" approach in 2014, later embodied in the Affordable Clean Energy rule that industry groups backed, when he served as Oklahoma’s attorney general. Under his blueprint, states would set emissions standards after a detailed unit-by-unit analysis, looking at what reductions are possible given "the engineering limits of each facility."
The EPA has not decided whether it will promulgate a new rule at all, though it has also proposed new pollution limits for coal and gas plants in separate actions. In a forthcoming advanced notice of proposed rulemaking, the EPA will ask "what inside-the-fence-line options are legal, feasible and appropriate," according to a document obtained by Bloomberg.
Increased efficiency at a coal plant -- known as heat-rate improvement -- translates into fewer carbon-dioxide emissions per unit of electric power generated.
Under Obama, the EPA envisioned utilities would make some straightforward efficiency improvements at coal-fired power plants as the first step to comply with the Clean Power Plan. But that was expected to coincide with bigger, broader changes -- such as using more cleaner-burning natural gas, adding more renewable power projects and simply encouraging customers to do a better job turning down their thermostats and turning off their lights.
Obama’s EPA didn’t ask utilities to wring every ounce of efficiency they could out of coal-fired power plants because they saw the other options as cheaper. A plant-specific approach "would be grossly insufficient to address the public health and environmental impacts from CO2 emissions," Obama’s EPA said.
That approach might yield modest emissions reductions and, in a perverse twist, might event have the opposite effect. If utilities make coal plants more efficient -- thereby driving down operating costs -- they also make them more competitive with natural gas and renewables, "so they might run more and pollute more," said Conrad Schneider, advocacy director for the Clean Air Task Force.
In a competitive market, any improvement in emissions produced for each unit of energy could be overwhelmed by an increase in electrical output, and debates over changes to electricity pricing under Trump and Perry added further uncertainty.
"A very minor heat rate improvement program would very likely result in increased emissions," Schneider said. "It might be worse than nothing."
Power companies want to get as much electricity as possible from every pound of coal, so they already have an incentive to keep efficiency high, said Jeff Holmstead, a former assistant EPA administrator now at Bracewell LLP. But an EPA regulation known as “new source review” has discouraged some from making those changes, for fear of triggering other pollution-control requirements, he said.
"If EPA’s replacement rule allows companies to improve efficiency without triggering new source review, it would make a real difference in terms of reducing carbon-dioxide emissions," Holmstead said.
Modest Impact
A plant-specific approach doesn’t have to mean modest impact.
"If you’re thinking about what can be done at the power plants by themselves, you don’t stop at efficiency tune-ups," said David Doniger, director of the Natural Resources Defense Council’s climate and clean air program. "You look at things like switching to natural gas or installing carbon capture and storage."
Requirements that facilities use carbon capture technology or swap in natural gas for coal could actually come close to hitting the same goals as in Obama’s Clean Power Plan -- if not go even further, Schneider said. They just would cost more.
The benefit of the Clean Power Plan "is that it enabled states to create programs and enabled companies to find a reduction strategy that was the most efficient and made the most sense for their own content," said Kathryn Zyla, deputy director of the Georgetown Climate Center. "And that flexibility was really important for the states and companies."
Some utilities, including Houston-based Calpine Corp., PG&E Corp. and Dominion Resources Inc., backed the Obama-era approach. And they are still pushing the Trump administration to be creative now.
"The Clean Power Plan achieved a thoughtful, balanced approach that gave companies and states considerable flexibility on how best to pursue that goal," said Melissa Lavinson, vice president of federal affairs and policy for PG&E’s Pacific Gas and Electric utility. “We look forward to working with the administration to devise an alternative plan for decarbonizing the U.S. economy."
Related News