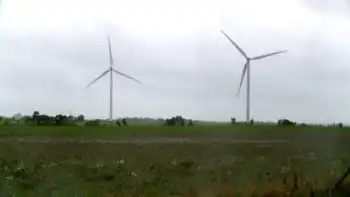
Billing rules stymie wind turbine use

By CBC News


Protective Relay Training - Basic

Our customized live online or in‑person group training can be delivered to your staff at your location.

  • Live Online
  • 12 hours Instructor-led
  • Group Training Available
Regular Price:
$699
Coupon Price:
$599
Reserve Your Seat Today
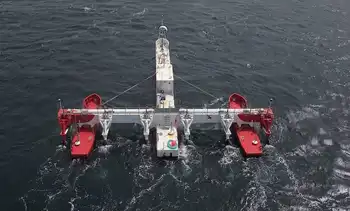
A PEI wind turbine company says its sales would improve dramatically if the government would move on promised changes to allow net billing.

Net billing allows a private wind turbine to supply power to more than one account. Many large users of electricity on the Island, such as farms and municipalities, have more than one account with Maritime Electric. Under the current rules, if one of those users were to erect a wind turbine, they could only supply one of those meters with electricity.

The restriction is frustrating for Duane Gorman, vice-president of wind turbine manufacturer Gorman Controls. He believes his sales are suffering because of it.

"There's a lot of interest out there, and certainly it could have a significant impact for individuals, for municipalities, for farmers," Gorman told CBC News.

Gorman said he has been lobbying for the change for three years, but is getting nowhere despite promises from government officials.

"We've been told that it's going to happen in the next session, and to date it's still not happened," he said.

The delay also bothers Mike Nabuurs, executive director of the PEI Federation of Agriculture. He said right now buying a wind turbine isn't cost effective for most PEI farmers, even though they're paying the highest electricity rates in the country.

"It's difficult for them to make the investment if they can't get the return on it that will offset that initial cost," said Nabuurs.

"That's really the main barrier right now."

The town of Stratford has also been lobbying for the changes.

"It just puts off the time we can start accruing those savings, and start reducing our greenhouse gas emissions," said town administrator Robert Hughes.

Hughes said the town could save $1.3 million over 20 years if it could power all its buildings and facilities off one turbine.

Related News

EIA: Pennsylvania exports the most electricity, California imports the most from other states

U.S. Electricity Trade by State, 2013-2017 highlights EIA grid patterns, interstate imports and exports, cross-border flows with Canada and Mexico, net exporters and importers, and market regions like ISOs and RTOs shaping consumption and generation.


Key Points

Brief EIA overview of interstate and cross-border power flows, ranking top net importers and exporters.

✅ Pennsylvania was the largest net exporter, averaging 59 million MWh.

✅ California was the largest net importer, averaging 77 million MWh.

✅ Top cross-border: NY, CA, VT, MN, MI imports; WA, TX, CA, NY, MT exports.


According to the U.S. Energy Information Administration (EIA) State Electricity Profiles, from 2013 to 2017, Pennsylvania was the largest net exporter of electricity, while California was the largest net importer.

Pennsylvania exported an annual average of 59 million megawatt-hours (MWh), while California imported an average of 77 million MWh annually.

Based on the share of total consumption in each state, the District of Columbia, Maryland, Massachusetts, Idaho and Delaware were the five largest power-importing states between 2013 and 2017, highlighting how some clean states import 'dirty' electricity as consumption outpaces local generation. Wyoming, West Virginia, North Dakota, Montana and New Hampshire were the five largest power-exporting states. Wyoming and West Virginia were net power exporting states between 2013 and 2017.

New York, California, Vermont, Minnesota and Michigan imported the most electricity from Canada or Mexico on average from 2013 to 2017, reflecting the U.S. look to Canada for green power during that period. Similarly, Washington, Texas, California, New York, and Montana exported the most electricity to Canada or Mexico, on average, during the same period.

Electricity routinely flows among the Lower 48 states and, to a lesser extent, between the United States and Canada and Mexico. From 2013 to 2017, Pennsylvania was the largest net exporter of electricity, sending an annual average of 59 million megawatthours (MWh) outside the state. California was the largest net importer, receiving an average of 77 million MWh annually.

Based on the share of total consumption within each state, the District of Columbia, Maryland, Massachusetts, Idaho, and Delaware were the five largest power-importing states between 2013 and 2017. Wyoming, West Virginia, North Dakota, Montana, and New Hampshire were the five largest power-exporting states. States with major population centers and relatively less generating capacity within their state boundaries tend to have higher ratios of net electricity imports to total electricity consumption, as utilities devote more to electricity delivery than to power production in many markets.

Wyoming and West Virginia were net power exporting states (they exported more power to other states than they consumed) between 2013 and 2017. Customers residing in these two states are not necessarily at an economic disadvantage or advantage compared with customers in neighboring states when considering their electricity bills and fees and market dynamics. However, large amounts of power trading may affect a state’s revenue derived from power generation.

Some states also import and export electricity outside the United States to Canada or Mexico, even as Canada's electricity exports face trade tensions today. New York, California, Vermont, Minnesota, and Michigan are the five states that imported the most electricity from Canada or Mexico on average from 2013 through 2017. Similarly, Washington, Texas (where electricity production and consumption lead the nation), California, New York, and Montana are the five states that exported the most electricity to Canada or Mexico, on average, for the same period.

Many states within the continental United States fall within integrated market regions, referred to as independent system operators or regional transmission organizations. These integrated market regions allow electricity to flow freely between states or parts of states within their boundaries.

EIA’s State Electricity Profiles provide details about the supply and disposition of electricity for each state, including net trade with other states and international imports and exports, and help you understand where your electricity comes from more clearly.


Related News

View more

India’s Kakrapur 3 achieves criticality

Kakrapar Unit 3 700MWe PHWR achieved first criticality, showcasing indigenously designed nuclear power, NPCIL operations, Make in India manufacturing, advanced safety systems, grid integration, and closed-fuel-cycle strategy for India's expansion of pressurised heavy water reactors.


Key Points

India's first indigenous 700MWe PHWR at Kakrapar reached criticality, advancing NPCIL's Make in India nuclear power.

✅ First indigenous 700MWe PHWR achieves criticality

✅ NPCIL-built, Make in India components and contractors

✅ Advanced safety: passive decay heat removal, containment spray


Unit 3 of India’s Kakrapar nuclear plant in Gujarat achieved criticality on 22 July, as milestones at nuclear projects worldwide continue to be reached. It is India’s first indigenously designed 700MWe pressurised heavy water reactor (PHWR) to achieve this milestone.

Prime Minister Narendra Modi congratulated nuclear scientists, saying the reactor is a shining example of the 'Make in India' campaign and of the government's steps to get nuclear back on track in recent years, and a trailblazer for many such future achievements. 

India developed its own nuclear power generation technology as it faced sanctions from the international community following its first nuclear weapons test in in 1974. It has not signed the Nuclear Non-Proliferation Treaty, while China's nuclear energy development is on a steady track according to experts. India has developed a three-stage nuclear programme based on a closed-fuel cycle, where the used fuel of one stage is reprocessed to produce fuel for the next stage.

Kakrapar 3 was developed and is operated by state-owned Nuclear Power Corporation of India Ltd (NPCIL), while in Europe KHNP considered for a Bulgarian project as countries weigh options. The first two units are 220MWe PHWRs commissioned in 1993 and 1995. NPCIL said in a statement that the components and equipment for Kakrapur 3 were “manufactured by lndian industries and the construction and erection was undertaken by various lndian contractors”.

The 700MWe PHWRs have advanced safety features such as steel lined inner containment, a passive decay heat removal system, a containment spray system, hydrogen management systems etc, the statement added.

Fuel loading was completed by mid-March, a crucial step in Abu Dhabi during its commissioning as well. “Thereafter, many tests and procedures were carried out during the lockdown period following all COVlD-19 guidelines.”

“As a next step, various experiments / tests will be conducted and power will be increased progressively, a path also followed by Barakah Unit 1 reaching 100% power before commercial operations.” Kakrapur 3 will be connected to the western grid and will be India’s 23rd nuclear power reactor.

Kakrapur 3 “is the front runner in a series of 16 indigenous 700MWe PHWRs which have been accorded administrative approval and financial sanction by the government and are at various stages of implementation”. Five similar units are under construction at Kakarapur 4, Rajasthan 7&8 and Gorakhpur1&2.

DAE said in January 2019 that India planned to put 21 new nuclear units with a combined generating capacity of 15,700MWe into operation by 2031, including ten indigenously designed PHWRs, while Bangladesh develops nuclear power with IAEA assistance. 


Related News

View more

Texas produces and consumes the most electricity in the US

Texas ERCOT Power Grid leads U.S. wind generation yet faces isolated interconnection, FERC exemption, and high industrial energy use, with distinct electricity and natural gas prices managed by a single balancing authority.


Key Points

The state-run interconnection that balances Texas electricity, isolated from FERC oversight and other U.S. grids.

✅ Largest U.S. wind power producer, high industrial demand

✅ Operates one balancing authority, independent interconnection

✅ Pays lower electricity, higher natural gas vs national average


For nearly two decades, the Lone Star State has generated more wind-sourced electricity than any other state in the U.S., according to the Energy Information Administration, or EIA.

In 2022, EIA reported Texas produced more electricity than any other state and generated twice as much as second-place Florida.

However, Texas also leads the country in another category. According to EIA, Texas is the largest energy-consuming state in the nation across all sectors with more than half of the state’s energy being used by the industrial sector.

As of May 2023, Texas residents paid 43% more for natural gas and around 10% less for electricity compared to the national average, according to EIA, and in competitive areas shopping for electricity is getting cheaper as well. Commercial and industrial sectors on average for the same month paid 25% less for electricity compared to the national average.


U.S. electric system compared to Texas
The U.S. electric system is essentially split into three regions called interconnections and are managed by a total of 74 entities called balancing authorities that ensure that power supply and demand are balanced throughout the region to prevent the possibility of blackouts, according to EIA.

The three regions (Interconnections):

Eastern Interconnection: Covers all U.S. states east of the Rocky Mountains, a portion of northern Texas, and consists of 36 balancing authorities.
Western Interconnection: Covers all U.S. states west of the Rockies and consists of 37 balancing authorities.
ERCOT: Covers the majority of Texas and consists of one balancing authority (itself).

During the 2021 winter storm, Texas electric cooperatives were credited with helping maintain service in many communities.

“ERCOT is unique in that the balancing authority, interconnection, and the regional transmission organization are all the same entity and physical system,” according to EIA, a structure often discussed in analyses of Texas power grid challenges today.

With this being the case, Texas is the only state in the U.S. that balances itself, the only state that is not subject to the jurisdiction of the Federal Energy Regulatory Commission, or FERC, and the only state that is not synchronously interconnected to the grid in the rest of the United States in the event of tight grid conditions, highlighting ongoing discussions about improving Texas grid reliability before peak seasons, according to EIA.

Every other state in the U.S. is connected to a web of multiple balancing authorities that contribute to ensuring power supply and demand are met.

California, for example, was the fourth largest electricity producer and the third largest electricity consumer in the nation in 2022, according to EIA, and California imports the most electricity from other states while Pennsylvania exports the most.

Although California produces significantly less electricity than Texas, it has the ability to connect with more than 10 neighboring balancing authorities within the Western Interconnection to interchange electricity, a dynamic that can see clean states importing dirty electricity under certain market conditions. ERCOT being independent only has electricity interchange with two balancing authorities, one of which is in Mexico.

Regardless of Texas’ unique power structure compared to the rest of the nation, the vast majority of the U.S. risked electricity supplies during this summer’s high heat, as outlined in severe heat blackout risks reports, according to EIA.


Related News

View more

EV Fires Raise Health Concerns for Firefighters

EV Firefighter Cancer Risks: lithium-ion battery fires, toxic metals like nickel and chromium, hazardous smoke plumes, and prolonged exposure threaten first responders; SCBA use, decontamination, and evidence-based protocols help reduce occupational health impacts.


Key Points

Health hazards from EV battery fires exposing responders to toxic metals and smoke, elevating long-term cancer risk.

✅ Nickel and chromium in EV smoke linked to lung and sinus cancers

✅ Use SCBA, on-scene decon, and post-incident cleaning to cut exposure

✅ Adopt EV fire SOPs: cooling, monitoring, isolation, air monitoring


As electric vehicles (EVs) become more popular, the EV fire risks to firefighters are becoming an increasing concern. These fires, fueled by the high-capacity lithium-ion batteries in EVs, produce dangerous chemical exposures that could have serious long-term health implications for first responders.

Claudine Buzzo, a firefighter and cancer survivor, knows firsthand the dangers that come with the profession. She’s faced personal health battles, including rare pancreatic cancer and breast cancer, both of which she attributes to the hazards of firefighting. Now, as EV adoption increases and some research links adoption to fewer asthma-related ER visits in local communities, Buzzo and her colleagues are concerned about how EV fires might add to their already heavy exposure to harmful chemicals.

The fire risks associated with EVs are different from those of traditional gasoline-powered vehicles. Dr. Alberto Caban-Martinez, who is leading a study at the Sylvester Comprehensive Cancer Center, explains that the high concentrations of metals released in the smoke from an EV fire are linked to various cancers. For instance, nickel, a key component in EV batteries, is associated with lung, nasal, and laryngeal cancers, while chromium, another metal found in some EV batteries, is linked to lung and sinus cancers.

Research from the Firefighter Cancer Initiative indicates that the plume of smoke from an EV fire contains significantly higher concentrations of these metals than fires from traditional vehicles. This raises the risk of long-term health problems for firefighters who respond to such incidents.

While the Electric Vehicle Association acknowledges the risks associated with various types of vehicle fires, they maintain that the lithium-ion batteries in EVs may not present a significantly higher risk than other common fire hazards, even as broader assessments suggest EVs are not a silver bullet for climate goals. Nonetheless, the growing body of research is causing concern among health experts, urging for further studies into how these new types of fires could affect firefighter health and how upstream electricity generation, where 18% of electricity in 2019 came from fossil fuels in Canada, factors into overall risk perceptions.

Fire departments and health researchers are working to understand the full scope of these risks and are emphasizing the importance of protective gear, such as self-contained breathing apparatuses, to minimize exposure during EV fire responses, while also considering questions like grid impacts during charging operations and EV sustainability improvements in different regions.


Related News

View more

$1.6 Billion Battery Plant Charges Niagara Region for Electric Vehicle Future

Ontario EV Battery Separator Plant anchors Canada's EV supply chain, with Asahi Kasei producing lithium-ion battery separators in Niagara Region to support Honda's Alliston assembly, clean transportation growth, and sustainable manufacturing jobs.


Key Points

Asahi Kasei's Niagara Region plant makes lithium-ion battery separators supplying Honda's EV factory in Ontario.

✅ Starts up by 2027 to align with Honda EV output timeline.

✅ Backed by clean tech tax credits and public investment.

✅ Boosts local jobs, R&D, and clean transportation leadership.


The automotive industry is undergoing a seismic shift, and Canada is firmly planting its flag in the electric vehicle (EV) revolution, propelled by recent EV assembly deals across the country. A new $1.6 billion battery component plant in Ontario's Niagara Region signifies a significant step towards a cleaner, more sustainable transportation future. This Asahi Kasei facility, a key player in Honda's $15 billion electric vehicle supply chain investment, promises to create jobs, boost the local economy, and solidify Ontario's position as a leader in clean transportation technology.

Honda's ambitious project forms part of Honda's Ontario EV investment that involves constructing a dedicated battery plant adjacent to their existing Alliston, Ontario assembly facility. This new plant will focus on producing fully electric vehicles, requiring a robust supply chain for critical components. Asahi Kasei's Niagara Region plant enters the picture here, specializing in the production of battery separators – a thin film crucial for separating the positive and negative electrodes within a lithium-ion battery. These separators play a vital role in ensuring the battery functions safely and efficiently.

The Niagara Region plant is expected to be operational by 2 027, perfectly aligning with Honda's EV production timeline. This strategic partnership benefits both companies: Honda secures a reliable source for a vital component, while Asahi Kasei capitalizes on the burgeoning demand for EV parts. The project is a catalyst for economic growth in Ontario, creating jobs in construction and manufacturing, supporting an EV jobs boom province-wide, and potentially future research and development sectors. Additionally, it positions the province as a hub for clean transportation technology, attracting further investment and fostering innovation.

This announcement isn't an isolated event. News of Volkswagen constructing a separate EV battery plant in St. Thomas, Ontario, and the continuation of a major EV battery project near Montreal further underscore Canada's commitment to electric vehicles. These developments signify a clear shift in the country's automotive landscape, with a focus on sustainable solutions.

Government support has undoubtedly played a crucial role in attracting these investments. The Honda deal involves up to $5 billion in public funds. Asahi Kasei's Niagara Region plant is also expected to benefit from federal and provincial clean technology tax credits. This demonstrates a collaborative effort between government and industry, including investments by Canada and Quebec in battery assembly, to foster a thriving EV ecosystem in Canada.

The economic and environmental benefits of this project are undeniable. Battery production is expected to create thousands of jobs, while the shift towards electric vehicles will lead to reduced emissions and a cleaner environment. Ontario stands to gain significantly from this transition, becoming a leader in clean energy technology and attracting skilled workers and businesses catering to the EV sector, especially as the U.S. auto pivot to EVs accelerates across the border.

However, challenges remain. Concerns about the environmental impact of battery production, particularly the sourcing of raw materials and the potential for hazardous waste, need to be addressed. Additionally, ensuring a skilled workforce capable of handling the complexities of EV technology is paramount.

Despite these challenges, the future of electric vehicles in Canada appears bright. Major automakers are making significant investments, government support is growing, and consumer interest in EVs is on the rise. The Niagara Region plant serves as a tangible symbol of Canada's commitment to a cleaner and more sustainable transportation future. With careful planning and continued Canada-U.S. collaboration across the sector, this project has the potential to revolutionize the Canadian automotive industry and pave the way for a greener tomorrow.


Related News

View more

Was there another reason for electricity shutdowns in California?

PG&E Wind Shutdown and Renewable Reliability examines PSPS strategy, wildfire risk, transmission line exposure, wind turbine cut-out speeds, grid stability, and California's energy mix amid historic high-wind events and supply constraints across service areas.


Key Points

An overview of PG&E's PSPS decisions, wildfire mitigation, and how wind cut-out limits influence grid reliability.

✅ Wind turbines reach cut-out near 55 mph, reducing generation.

✅ PSPS mitigates ignition from damaged transmission infrastructure.

✅ Baseload diversity improves resilience during high-wind events.


According to the official, widely reported story, Pacific Gas & Electric (PG&E) initiated power shutoffs across substantial portions of its electric transmission system in northern California as a precautionary measure.

Citing high wind speeds they described as “historic,” the utility claims that if it didn’t turn off the grid, wind-caused damage to its infrastructure could start more wildfires.

Perhaps that’s true. Perhaps. This tale presumes that the folks who designed and maintain PG&E’s transmission system are unaware of or ignored the need to design it to withstand severe weather events, and that the Federal Energy Regulatory Commission (FERC) and North American Electric Reliability Corp. (NERC) allowed the utility to do so.

Ignorance and incompetence happens, to be sure, but there’s much about this story that doesn’t smell right—and it’s disappointing that most journalists and elected officials are apparently accepting it without question.

Take, for example, this statement from a Fox News story about the Kincade Fires: “A PG&E meteorologist said it’s ‘likely that many trees will fall, branches will break,’ which could damage utility infrastructure and start a fire.”

Did you ever notice how utilities cut wide swaths of trees away when transmission lines pass through forests? There’s a reason for that: When trees fall and branches break, the grid can still function, and even as the electric rhythms of New York City shifted during COVID-19, operators planned for variability.

So, if badly designed and poorly maintained infrastructure isn’t the reason PG&E cut power to millions of Californians, what might have prompted them to do so? Could it be that PG&E’s heavy reliance on renewable energy means they don’t have the power to send when a “historic” weather event occurs, especially as policymakers weigh the postponed closure of three power plants elsewhere in California?


Wind Speed Limits

The two most popular forms of renewable energy come with operating limitations, which is why some energy leaders urge us to keep electricity options open when planning the grid. With solar power, the constraint is obvious: the availability of sunlight. One doesn’t generate solar power at night and energy generation drops off with increasing degrees of cloud cover during the day.

The main operating constraint of wind power is, of course, wind speed, and even in markets undergoing 'transformative change' in wind generation, operators adhere to these technical limits. At the low end of the scale, you need about a 6 or 7 miles-per-hour wind to get a turbine moving. This is called the “cut-in speed.” To generate maximum power, about a 30 mph wind is typically required. But, if the wind speed is too high, the wind turbine will shut down. This is called the “cut-out speed,” and it’s about 55 miles per hour for most modern wind turbines.

It may seem odd that wind turbines have a cut-out speed, but there’s a very good reason for it. Each wind turbine rotor is connected to an electric generator housed in the turbine nacelle. The connection is made through a gearbox that is sized to turn the generator at the precise speed required to produce 60 Hertz AC power.

The blades of the wind turbine are airfoils, just like the wings of an airplane. Adjusting the pitch (angle) of the blades allows the rotor to maintain constant speed, which, in turn, allows the generator to maintain the constant speed it needs to safely deliver power to the grid. However, there’s a limit to blade pitch adjustment. When the wind is blowing so hard that pitch adjustment is no longer possible, the turbine shuts down. That’s the cut-out speed.

Now consider how California’s power generation profile has changed. According to Energy Information Administration data, the state generated 74.3 percent of its electricity from traditional sources—fossil fuels and nuclear, amid debates over whether to classify nuclear as renewable—in 2001. Hydroelectric, geothermal, and biomass-generated power accounted for most of the remaining 25.7 percent, with wind and solar providing only 1.98 percent of the total.

By 2018, the state’s renewable portfolio had jumped to 43.8 percent of total generation, with clean power increasing and wind and solar now accounting for 17.9 percent of total generation. That’s a lot of power to depend on from inherently unreliable sources. Thus, it wouldn’t be at all surprising to learn that PG&E didn’t stop delivering power out of fear of starting fires, but because it knew it wouldn’t have power to deliver once high winds shut down all those wind turbines


Related News

View more

Sign Up for Electricity Forum’s Newsletter

Stay informed with our FREE Newsletter — get the latest news, breakthrough technologies, and expert insights, delivered straight to your inbox.

Electricity Today T&D Magazine Subscribe for FREE

Stay informed with the latest T&D policies and technologies.
  • Timely insights from industry experts
  • Practical solutions T&D engineers
  • Free access to every issue

Download the 2025 Electrical Training Catalog

Explore 50+ live, expert-led electrical training courses –

  • Interactive
  • Flexible
  • CEU-cerified