Fire touches off power outage across Florida

By St. Petersburg Times


Electrical Testing & Commissioning of Power Systems

Our customized live online or in‑person group training can be delivered to your staff at your location.

  • Live Online
  • 12 hours Instructor-led
  • Group Training Available
Regular Price:
$599
Coupon Price:
$499
Reserve Your Seat Today
For everyone who crept through unlit intersections and sat in darkened classrooms during the widespread Florida blackout on February 26, here's the message from Florida Power & Light: The state's electric system works.

Works, that is, but for a small fire in a western Miami-Dade County substation run by FPL. The as-yet unexplained fire caused a cascade of power outages throughout the state.

The fire triggered safety shutdowns of at least five power plants - including two nuclear reactors in South Florida - while simultaneously causing the massive blackout.

At the height of the midday outage, more than 2-million people in 31 counties lacked electricity, including more than 200,000 customers in the Tampa Bay area. The vast majority of customers had power by 6 p.m., according to the state emergency operations center.

But the utilities are claiming success. The blackout protected the system from severe damage that might have caused outages that stretched on far longer than one afternoon, said Mayco Villafana, spokesman for FPL.

"The system worked as it was designed to do," he said.

At a hastily arranged news conference Tuesday evening in St. Petersburg, Gov. Charlie Crist echoed FPL's good cheer.

"What today I think proved is that our utilities are up to the task," Crist said.

So, what happened?

The blackout began around 1:10 p.m. when a disconnect switch at the Miami-Dade substation caught fire, Villafana said. A disconnect switch typically allows utilities to isolate pieces of equipment from the flow of electricity, so workers canfix equipment without getting electrocuted.

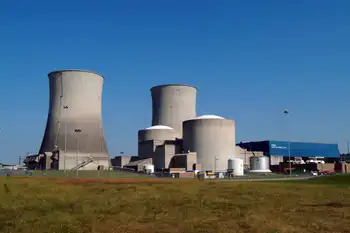
The malfunctioning switch created dangerous problems in the way power flows throughout the state's system. Several power plants quickly shut down to protect themselves from critical damage. At FPL's Turkey Point power station, two nuclear reactors and a natural gas plant shut down. Tampa Electric lost two small natural gas plants, one at its Bayside power station and the other in Polk County, said spokeswoman Laura Duda.

All told, the state's interconnected transmission grid abruptly lost about 2,500-megawatts of incoming electricity, enough to power more than 800,000 homes, most of it in FPL territory, said Linda Campbell, vice president of the Florida Reliability Coordinating Council, the organization that sets and enforces reliability standards for Florida's grid.

That sudden loss of power created new problems in the transmission grid, Campbell said. Again, safety features responded by "shedding load," cutting off power to as many as 950,000 customers throughout the state.

In layman's terms, the system turned off your lights to protect itself.

The swiftly widening blackout left utilities scrambling to restore power. In FPL territory, 475,000 customers lost power, as did an additional 475,000 customers throughout the rest of the state, Villafana said. FPL estimated that more than 2-million people lacked power, while the state offered an early estimate of more than 4-million people in the dark.

Drivers crept uneasily through unlit intersections. Miami International Airport switched to backup generators, as did hospitals. Fire-rescue units worked to free people from stalled elevators. A special state House election in Brevard County went on as scheduled with backup generators powering voting machines.

In the Tampa Bay area, power went out to nearly 225,000 locations, most for about an hour. Hardest hit were the areas around the University of South Florida in Tampa, and parts of east Hillsborough County, including Brandon, Riverview and Valrico.

At the USF library, a generator failed, prompting police to start evacuating about 1,000 people down emergency-lit stairways. Police guided traffic along major thoroughfares such as Fletcher and Hillsborough avenues. Traffic signals at U.S. 19 and Gulf-to-Bay in Clearwater went dark. At Eckerd College, some instructors moved classes outdoors. Pasco County public schools canceled after-school activities.

At the height of the outage, about 153,000 Progress Energy customers, 50,000 Tampa Electric customers, and about 19,000 customers of Withlacoochee River Electric Cooperative lost power.

Four Hillsborough County schools were blacked out between 1:05 p.m. and 2:05 p.m., said Linda Cobbe, schools spokeswoman. All were in the FishHawk area: Bevis and Buckhorn elementary schools, Randall Middle School, and Newsome High School.

The state's emergency operations center quickly ramped up to its highest level of alert. Crist spent the afternoon reaching out to the heads of Florida's power companies. He also had been in contact with the Florida National Guard in the event the outage dragged on into the evening.

Most customers had power back quickly. FPL faced additional problems because it had several transmission lines down for routine maintenance, Campbell said. That limited how other utilities could route power to its customers.

By 6 p.m., the state reported that all but 40,000 customers had power restored, and that the number was falling quickly.

Despite FPL's explanation, a slew of unanswered questions remain. What caused the fire? Why did a switch malfunction cascade into statewide blackouts? The Juno Beach utility promised a thorough investigation.

Those questions could take weeks to answer, said Campbell. The Florida Reliability Coordinating Council will investigate, as will the Florida Public Service Commission, according to Crist.

The blackout leaves some lingering aftereffects. As of the evening of February 26, FPL hadn't brought its Turkey Point nuclear reactors back online. That process can take 12 hours or more, said FPL spokeswoman April Schilpp. She declined to comment on when the reactors would come back up.

Roger Hannah, a spokesman for the Nuclear Regulatory Commission, said the commission had no safety concerns about the reactors. They shut down for safety reasons, as they were designed to do, he said.

Related News

Christmas electricity spike equivalent to roasting 1.5 million turkeys: BC Hydro

BC Hydro Holiday Energy Saving Tips highlight electricity usage trends and power conservation during Christmas cooking. Use efficient appliances, lower the thermostat, and track consumption with MyHydro to reduce bills while hosting guests.


Key Points

Guidelines from BC Hydro to cut holiday electricity usage via efficient cooking, smart thermostats, and MyHydro tracking.

✅ Use microwave, toaster oven, or slow cooker to save power.

✅ Batch-bake cookies and pies to minimize oven cycles.

✅ Set thermostat to 18 C and monitor use with MyHydro.


BC Hydro is reminding British Columbians to conserve power over the holidays after a report commissioned by the utility found the arrival of guests for Christmas dinner results in a 15% increase in electricity usage, and it expects holiday usage to rise as gatherings ramp up.

Cooking appears to be the number one culprit for the uptick in peoples’ hydro bills. According to BC Hydro press release, British Columbians use about 8,000 megawatt hours more of electricity by mid-day Christmas — that's about 1.5 million turkeys roasted in electric ovens — while Ontario electricity demand shifted as people stayed home during the pandemic.
 article continues below 

About 95% of British Columbians said they would make meals at home from scratch over the holiday season, mirroring the uptick in residential electricity use observed during the pandemic. The survey found that inviting friends or family over trumped any plans people had to buy pre-made meals or order take-out. Six in 10 respondents said they would also rather bake holiday treats than pick them up pre-made from the store. 

The survey also showed people in B.C. are taking steps to reduce their electricity usage, echoing earlier findings that many British Columbians changed daily electricity habits during the pandemic. When participants were asked whether they were conscious of how much electricity they used when visiting friends or family, 80% said they would be taking steps to limit their usage.


And while cooking meals from scratch over the holidays may contribute to a spike in a person's electricity bill, some studies have found that, when comparing their overall environmental impact against that of ready-made meals, a roasted dinner has a lower negative impact.

Still, there are many ways to improve your energy efficiency and save some money over the holiday season, and conserving can also help the grid during events like the recent atypical storm response noted by BC Hydro. BC Hydro recommends:

• using smaller appliances whenever possible, such as a microwave, crockpot or toaster oven as they use less than half the power of a regular electric oven;

• baking cookies or pies in batches to save energy;

• turning down the household thermostat to 18 C when possible to reduce costs during peak hydro rates where applicable;

• and tracking how much electricity you use through the MyHydro tool alongside potential time-of-use rates for smarter scheduling


Related News

View more

Coronavirus could stall a third of new U.S. utility solar this year: report

U.S. Utility-Scale Solar Delays driven by the coronavirus pandemic threaten construction timelines, supply chains, and financing, with interconnection and commissioning setbacks, module sourcing risks in Southeast Asia, and tax credit deadline pressures impacting project delivery.


Key Points

Setbacks to large U.S. solar builds from COVID-19 impacting construction, supply, financing, and permitting.

✅ Construction, interconnection, commissioning site visits delayed

✅ Supply chain risks for modules from Southeast Asia

✅ Tax credit deadline extensions sought by developers


About 5 gigawatts (GW) of big U.S. solar energy projects, enough to power nearly 1 million homes, could suffer delays this year if construction is halted for months due to the coronavirus pandemic, as the Covid-19 crisis hits renewables across the sector, according to a report published on Wednesday.

The forecast, a worst-case scenario laid out in an analysis by energy research firm Wood Mackenzie, would amount to about a third of the utility-scale solar capacity expected to be installed in the United States this year, even as US solar and wind growth continues under favorable plans.

The report comes two weeks after the head of the top U.S. solar trade group called the coronavirus pandemic (as solar jobs decline nationwide) "a crisis here" for the industry. Solar and wind companies are pleading with Congress to extend deadlines for projects to qualify for sunsetting federal tax credits.

Even the firm’s best-case scenario would result in substantial delays, mirroring concerns that wind investments at risk across the industry. With up to four weeks of disruption, the outbreak will push out 2 GW of projects, or enough to power about 380,000 homes. Before factoring in the impact of the coronavirus, Wood Mackenzie had forecast 14.7 GW of utility-scale solar projects would be installed this year.

In its report, the firm said the projects are unlikely to be canceled outright. Rather, they will be pushed into the second half of 2020 or 2021. The analysis assumes that virus-related disruptions subside by the end of the third quarter.

Mid-stage projects that still have to secure financing and receive supplies are at the highest risk, Wood Mackenzie analyst Colin Smith said in an interview, adding that it was too soon to know whether the pandemic would end up altering long-term electricity demand and therefore utility procurement plans, where policy shifts such as an ITC extension could reshape priorities.

Currently, restricted travel is the most likely cause of project delays, the report said. Developers expect delays in physical site visits for interconnection and commissioning, and workers have had difficulty reaching remote construction sites.

For earlier-stage projects, municipal offices that process permits are closed and in-person meetings between developers and landowners or local officials have slowed down.

Most solar construction is proceeding despite stay at home orders in many states because it is considered critical infrastructure, and long-term proposals like a tenfold increase in solar could reshape the outlook, the report said, adding that “that could change with time.”

Risks to supplies of solar modules include potential manufacturing shutdowns in key producing nations in Southeast Asia such as Malaysia, Vietnam and Thailand. Thus far, solar module production has been identified as an essential business and has been allowed to continue.


Related News

View more

Renewable energy now cheapest option for new electricity in most of the world: Report

Renewable Energy Cost Trends highlight IRENA data showing solar and wind undercut coal, as utility-scale projects drive lower levelized electricity costs worldwide, with the Middle East and UAE advancing mega solar parks.


Key Points

They track how solar and wind undercut new fossil fuels as utility-scale costs drop and investment accelerates.

✅ IRENA reports renewables cheapest for new installations

✅ Solar and wind LCOE fell sharply since 2010

✅ Middle East and UAE scale mega utility projects


Renewable energy is now the cheapest option for new electricity installation in most of the world, a report from the International Renewable Energy Agency (IRENA) on Tuesday said.

Renewable power projects have undercut traditional coal fuel plants, with solar and wind power costs in particular falling as record-breaking growth continues worldwide.

“Installing new renewables increasingly costs less than the cheapest fossil fuels. With or without the health and economic crisis, dirty coal plants were overdue to be consigned to the past, said Francesco La Camera, director-general of IRENA said in the report.

In 2019, renewables accounted for around 72 percent of all new capacity added worldwide, IRENA said, following a 2016 record year that highlighted the momentum, with lowering costs and technological improvements in solar and wind power helping this dynamic. For solar energy, IRENA notes that the cost for electricity from utility-scale plants fell by 82 percent in the decade between 2010 and 2019, as China's solar PV growth underscored in 2016.

“More than half of the renewable capacity added in 2019 achieved lower electricity costs than new coal, while new solar and wind projects are also undercutting the cheapest and least sustainable of existing coal-fired plants,” Camera added.

Costs for solar and wind power also fell year-on-year by 13 and 9 percent, respectively, with offshore wind costs showing steep declines as well. In 2019, more than half of all newly commissioned utility-scale renewable power plants provided electricity cheaper than the lowest cost of a new fossil fuel plant.

The Middle East

In mid-May, a report by UK-based law firm Ashurst suggested the Middle East is the second most popular region for renewable energy investment after North America, at a time when clean energy investment is outpacing fossil fuels.

The region is home to some of the largest renewable energy bets in the world, with Saudi wind expansion gathering pace. The UAE, for instance, is currently developing the Mohammed Bin Rashid Solar Park, the world’s largest concentrated solar power project in the world.

Around 26 percent of Middle East respondents in Ashurst’s survey said that they were presently investing in energy transition, marking the region as the most popular for current investment in renewables, while 11 percent added that they were considering investing.

In North America, the most popular region, 28 percent said that they were currently investing, with 11 percent stating they are considering investing.


Related News

View more

Switch from fossil fuels to electricity could cost $1.4 trillion, Canadian Gas Association warns

Canada Electrification Costs: report estimates $580B-$1.4T to scale renewable energy, wind, solar, and storage capacity to 2050, shifting from natural gas toward net-zero emissions and raising average household energy spending by $1,300-$3,200 annually.


Key Points

Projected national expense to expand renewables and electrify energy systems by 2050, impacting household energy bills.

✅ $580B-$1.4T forecast for 2020-2050 energy transition

✅ 278-422 GW wind, solar, storage capacity by 2050

✅ Household costs up $1,300-$3,200 per year on average


The Canadian Gas Association says building renewable electricity capacity to replace just half of Canada's current fossil fuel-generated energy, a shift with significant policy implications for grids across provinces, could increase national costs by as much as $1.4 trillion over the next 30 years.

In a report, it contends, echoing an IEA report on net-zero, that growing electricity's contribution to Canada's energy mix from its current 19 per cent to about 60 per cent, a step critical to meeting climate pledges that policymakers emphasize, will require an expansion from 141 gigawatts today to between 278 and 422 GW of renewable wind, solar and storage capacity by 2050.

It says that will increase national energy costs by between $580 billion and $1.4 trillion between 2020 and 2050, a projection consistent with recent reports of higher electricity prices in Alberta amid policy shifts, translating into an average increase in Canadian household spending of $1,300 to $3,200 per year.

The study, prepared by consulting firm ICF for the association, assumes electrification begins in 2020 and is applied in all feasible applications by 2050, with investments in the electricity system, guided by the implications of decarbonizing the grid for reliability and cost, proceeding as existing natural gas and electric end use equipment reaches normal end of life.

Association CEO Tim Egan says the numbers are "pretty daunting" and support the integration of natural gas with electric, amid Canada's race to net-zero commitments, instead of using an electric-only option as the most cost-efficient way for Canada to reach environmental policy goals.

But Keith Stewart, senior energy strategist with Greenpeace Canada, says scientists are calling for the world to get to net-zero emissions by 2050, and Canada's net-zero by 2050 target underscores that urgency to avoid "catastrophic" levels of warming, so investing in natural gas infrastructure to then shut it down seems a "very expensive option."


Related News

View more

Learn how fees and usage impacts your electricity bill in new online CER tool

CER Interactive Electricity Bill Tool compares provincial electricity prices, fees, taxes, and usage. Explore household appliance costs, hydroelectric generation, and consumption trends across Canada with interactive calculators and a province-by-province breakdown.


Key Points

An online CER report with calculators comparing electricity prices, fees, and usage to explain household energy costs.

✅ Province-by-province bill, price, and consumption comparison

✅ Calculator for appliance and electronics energy costs

✅ Explains fees, taxes, regulation, and generation sources


Canadians have a new way to assess their electricity bill in a new, interactive online report released by the Canada Energy Regulator (CER).

The report titled What is in a residential electricity bill? features a province-to-province comparison of electricity bills, generation and consumption. It also explains electricity prices across the country, including how Calgary electricity prices have changed, allowing people to understand why costs vary depending on location, fees, regulation and taxes.  

Learn how fees and usage impacts your electricity bill in new online CER tool
Interactive tools allow people to calculate the cost of household appliances and electronic use for each province and territory, and to understand how Ontario rate increases may affect monthly bills. For example, an individual can use the tools to find out that leaving a TV on for 24-hours in Quebec costs $5.25 per month, while that same TV on for a whole day would cost $12.29 per month in Saskatchewan, $20.49 per month in the Northwest Territories, and $15.30 per month in Nova Scotia.

How Canadians use energy varies as much as how provinces and territories produce it, especially in regions like Nunavut where unique conditions influence costs. Millions of Canadians rely on electricity to power their household appliances, charge their electronics, and heat their homes. Provinces with abundant hydro-electric resources like Quebec, B.C., Manitoba, and Newfoundland and Labrador use electricity for home heating and tend to consume the most electricity.

By gathering data from various sources, this report is the first Canadian publication that features interactive tools to allow for a province-by-province comparison of electricity bills while highlighting different elements within an electricity bill, a helpful context as Canada faces a critical supply crunch in the years ahead.

The CER monitors energy markets and assesses Canadian energy requirements and trends, including clean electricity regulations developments that shape pricing. This report is part of a portfolio of publications on energy supply, demand and infrastructure that the CER publishes regularly as part of its ongoing market monitoring.

"No matter where you go in the country, Canadians want to know how much they pay for power and why, especially amid price spikes in Alberta this year," says lead author Colette Craig. "This innovative, interactive report really explains electricity bills to help everyone understand electricity pricing and consumption across Canada."

Quick Facts

  • Quebec ranks first in electricity consumption per capita at 21.0 MW.h, followed by Saskatchewan at 20.0 MW.h, Newfoundland and Labrador at 19.3 MW.h.
  • About 95% of Quebec's electricity is produced from hydroelectricity.
  • Provinces that use electricity for home heating tend to consume the most electricity.
  • Canada's largest consuming sector for electricity was industrial at 238 TW.h. The residential and commercial sectors consumed 168 TW.h and 126 TW.h, respectively.
  • In 2018, Canada produced 647.7 terawatt hours (TW.h) of electricity. More than half of the electricity in Canada (61%) is generated from hydro sources. The remainder is produced from a variety of sources, such as fossil fuels (natural gas and petroleum), nuclear, wind, coal, biomass, solar.
  • Canada is a net exporter of electricity. In 2019, net exports to the U.S. electricity market totaled 47.0 TW.h.
  • The total value of Canada's electricity exports was $2.5 billion Canadian dollars and the value of imports was $0.6 billion Canadian dollars, resulting in 2019 net exports of $1.9 billion.
  • All regions in Canada are reflected in this report but it does not include data that reflects the COVID-19 lockdown and its effects on residential electricity bills.


Related News

View more

Six key trends that shaped Europe's electricity markets in 2020

European Electricity Market Trends 2020 highlight decarbonisation, rising renewables, EV adoption, shifting energy mix, COVID-19 impacts, fuel switching, hydro, wind and solar growth, gas price dynamics, and wholesale electricity price increases.


Key Points

EU power in 2020 saw lower emissions, more renewables, EV growth, demand shifts, and higher wholesale prices.

✅ Power sector CO2 down 14% on higher renewables, lower coal

✅ Renewables 39% vs fossil 36%; hydro, wind, solar expanded

✅ EV share hit 17%; wholesale prices rose with gas, ETS costs


According to the Market Observatory for Energy DG Energy report, the COVID-19 pandemic and favorable weather conditions are the two key drivers of the trends experienced within the European electricity market in 2020. However, the two drivers were exceptional or seasonal.

The key trends within Europe’s electricity market include:


1. Decrease in power sector’s carbon emissions

As a result of the increase in renewables generation and decrease in fossil-fueled power generation in 2020, the power sector was able to reduce its carbon footprint by 14% in 2020. The decrease in the sector’s carbon footprint in 2020 is similar to trends witnessed in 2019 when fuel switching was the main factor behind the decarbonisation trend.

However, most of the drivers in 2020 were exceptional or seasonal (the pandemic, warm winter, high
hydro generation). However, the opposite is expected in 2021, with the first months of 2021 having relatively cold weather, lower wind speeds and higher gas prices, with stunted hydro and nuclear output also cited, developments which suggest that the carbon emissions and intensity of the power sector could rise.

The European Union is targeting to completely decarbonise its power sector by 2050 through the introduction of supporting policies such as the EU Emissions Trading Scheme, the Renewable Energy Directive and legislation addressing air pollutant emissions from industrial installations, with expectations that low-emissions sources will cover most demand growth in the coming years.

According to the European Environment Agency, Europe halved its power sector’s carbon emissions in 2019 from 1990 levels.


2. Changes in energy consumption

EU consumption of electricity fell by -4% as majority of industries did not operate at full level during the first half of 2020. Although majority of EU residents stayed at home, meaning an increase in residential energy use, rising demand by households could not reverse falls in other sectors of the economy.

However, as countries renewed COVID-19 restrictions, energy consumption during the 4th quarter was closer to the “normal levels” than in the first three quarters of 2020. 

The increase in energy consumption in the fourth quarter of 2020 was also partly due to colder temperatures compared to 2019 and signs of surging electricity demand in global markets.


3. Increase in demand for EVs

As the electrification of the transport system intensifies, the demand for electric vehicles increased in 2020 with almost half a million new registrations in the fourth quarter of 2020. This was the highest figure on record and translated into an unprecedented 17% market share, more than two times higher than in China and six times higher than in the United States.

However, the European Environment Agency (EEA)argues that the EV registrations were lower in 2020 compared to 2019. EEA states that in 2019, electric car registrations were close to 550 000 units, having reached 300 000 units in 2018.


4. Changes in the region’s energy mix and increase in renewable energy generation

The structure of the region’s energy mix changed in 2020, according to the report.

Owing to favorable weather conditions, hydro energy generation was very high and Europe was able to expand its portfolio of renewable energy generation such that renewables (39%) exceeded the share of fossil fuels (36%) for the first time ever in the EU energy mix.

Rising renewable generation was greatly assisted by 29 GW of wind and solar capacity additions in 2020, which is comparable to 2019 levels. Despite disrupting the supply chains of wind and solar resulting in project delays, the pandemic did not significantly slow down renewables’ expansion.

In fact, coal and lignite energy generation fell by 22% (-87 TWh) and nuclear output dropped by 11% (-79 TWh). On the other hand, gas energy generation was not significantly impacted owing to favorable prices which intensified coal-to-gas and lignite-to-gas switching, even as renewables crowd out gas in parts of the market.


5. Retirement of coal energy generation intensify

 As the outlook for emission-intensive technologies worsens and carbon prices rise, more and more early coal retirements have been announced. Utilities in Europe are expected to continue transitioning from coal energy generation under efforts to meet stringent carbon emissions reduction targets and as they try to prepare themselves for future business models that they anticipate to be entirely low-carbon reliant.

6. Increase in wholesale electricity prices

In recent months, more expensive emission allowances, along with rising gas prices, have driven up wholesale electricity prices on many European markets to levels last seen at the beginning of 2019. The effect was most pronounced in countries that are dependent on coal and lignite. The wholesale electricity prices dynamic is expected to filter through to retail prices.

The rapid sales growth in the EVs sector was accompanied by expanding charging infrastructure. The number of high-power charging points per 100 km of highways rose from 12 to 20 in 2020.


Related News

View more

Sign Up for Electricity Forum’s Newsletter

Stay informed with our FREE Newsletter — get the latest news, breakthrough technologies, and expert insights, delivered straight to your inbox.

Electricity Today T&D Magazine Subscribe for FREE

Stay informed with the latest T&D policies and technologies.
  • Timely insights from industry experts
  • Practical solutions T&D engineers
  • Free access to every issue

Download the 2025 Electrical Training Catalog

Explore 50+ live, expert-led electrical training courses –

  • Interactive
  • Flexible
  • CEU-cerified