Power Grid Climate Resilience demands storm hardening, underground power lines, microgrids, batteries, and renewable energy as regulators and utilities confront climate change, sea level rise, and extreme weather to reduce outages and protect vulnerable communities.
Key Points
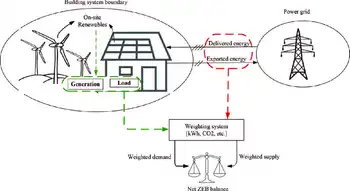
It is the grid capacity to resist and recover from climate hazards using buried lines, microgrids, and batteries.
✅ Underground lines reduce wind outages and wildfire ignition risk.
✅ Microgrids with solar and batteries sustain critical services.
✅ Regulators balance cost, resilience, equity, and reliability.
Every time a storm lashes the Carolina coast, the power lines on Tonye Gray’s street go down, cutting her lights and air conditioning. After Hurricane Florence in 2018, Gray went three days with no way to refrigerate medicine for her multiple sclerosis or pump the floodwater out of her basement.
What you need to know about the U.N. climate summit — and why it matters
“Florence was hell,” said Gray, 61, a marketing account manager and Wilmington native who finds herself increasingly frustrated by the city’s vulnerability.
“We’ve had storms long enough in Wilmington and this particular area that all power lines should have been underground by now. We know we’re going to get hit.”
Across the nation, severe weather fueled by climate change is pushing aging electrical systems past their limits, often with deadly results. Last year, amid increasing nationwide blackouts, the average American home endured more than eight hours without power, according to the U.S. Energy Information Administration — more than double the outage time five years ago.
This year alone, a wave of abnormally severe winter storms caused a disastrous power failure in Texas, leaving millions of homes in the dark, sometimes for days, and at least 200 dead. Power outages caused by Hurricane Ida contributed to at least 14 deaths in Louisiana, as some of the poorest parts of the state suffered through weeks of 90-degree heat without air conditioning.
As storms grow fiercer and more frequent, environmental groups are pushing states to completely reimagine the electrical grid, incorporating more grid-scale batteries, renewable energy sources and localized systems known as “microgrids,” which they say could reduce the incidence of wide-scale outages. Utility companies have proposed their own storm-proofing measures, including burying power lines underground.
But state regulators largely have rejected these ideas, citing pressure to keep energy rates affordable. Of $15.7 billion in grid improvements under consideration last year, regulators approved only $3.4 billion, according to a national survey by the NC Clean Energy Technology Center — about one-fifth, highlighting persistent vulnerabilities in the grid nationwide.
After a weather disaster, “everybody’s standing around saying, ‘Why didn’t you spend more to keep the lights on?’ ” Ted Thomas, chairman of the Arkansas Public Service Commission, said in an interview with The Washington Post. “But when you try to spend more when the system is working, it’s a tough sell.”
A major impediment is the failure by state regulators and the utility industry to consider the consequences of a more volatile climate — and to come up with better tools to prepare for it. For example, a Berkeley Lab study last year of outages caused by major weather events in six states found that neither state officials nor utility executives attempted to calculate the social and economic costs of longer and more frequent outages, such as food spoilage, business closures, supply chain disruptions and medical problems.
“There is no question that climatic changes are happening that directly affect the operation of the power grid,” said Justin Gundlach, a senior attorney at the Institute for Policy Integrity, a think tank at New York University Law School. “What you still haven’t seen … is a [state] commission saying: 'Isn’t climate the through line in all of this? Let’s examine it in an open-ended way. Let’s figure out where the information takes us and make some decisions.’ ”
In interviews, several state commissioners acknowledged that failure.
“Our electric grid was not built to handle the storms that are coming this next century,” said Tremaine L. Phillips, a commissioner on the Michigan Public Service Commission, which in August held an emergency meeting to discuss the problem of power outages. “We need to come up with a broader set of metrics in order to better understand the success of future improvements.”
Five disasters in four years
The need is especially urgent in North Carolina, where experts warn Atlantic grids and coastlines need a rethink as the state has declared a federal disaster from a hurricane or tropical storm five times in the past four years. Among them was Hurricane Florence, which brought torrential rain, catastrophic flooding and the state’s worst outage in over a decade in September 2018.
More than 1 million residents were left disconnected from refrigerators, air conditioners, ventilators and other essential machines, some for up to two weeks. Elderly residents dependent on oxygen were evacuated from nursing homes. Relief teams flew medical supplies to hospitals cut off by flooded roads. Desperate people facing closed stores and rotting food looted a Wilmington Family Dollar.
“I have PTSD from Hurricane Florence, not because of the actual storm but the aftermath,” said Evelyn Bryant, a community organizer who took part in the Wilmington response.
The storm reignited debate over a $13 billion proposal by Duke Energy, one of the largest power companies in the nation, to reinforce the state’s power grid. A few months earlier, the state had rejected Duke’s request for full repayment of those costs, determining that protecting the grid against weather is a normal part of doing business and not eligible for the type of reimbursement the company had sought.
After Florence, Duke offered a smaller, $2.5 billion plan, along with the argument that severe weather events are one of seven “megatrends” (including cyberthreats and population growth) that require greater investment, according to a PowerPoint presentation included in testimony to the state. The company owns the two largest utilities in North Carolina, Duke Energy Carolinas and Duke Energy Progress.
Vote Solar, a nonprofit climate advocacy group, objected to Duke’s plan, saying the utility had failed to study the risks of climate impacts. Duke’s flood maps, for example, had not been updated to reflect the latest projections for sea level rise, they said. In testimony, Vote Solar claimed Duke was using environmental trends to justify investments “it had already decided to pursue.”
The United States is one of the few countries where regulated utilities are usually guaranteed a rate of return on capital investments, even as studies show the U.S. experiences more blackouts than much of the developed world. That business model incentivizes spending regardless of how well it solves problems for customers and inspires skepticism. Ric O’Connell, executive director of GridLab, a nonprofit group that assists state and regional policymakers on electrical grid issues, said utilities in many states “are waving their hands and saying hurricanes” to justify spending that would do little to improve climate resilience.
In North Carolina, hurricanes convinced Republicans that climate change is real
Duke Energy spokesman Jeff Brooks acknowledged that the company had not conducted a climate risk study but pointed out that this type of analysis is still relatively new for the industry. He said Duke’s grid improvement plan “inherently was designed to think about future needs,” including reinforced substations with walls that rise several feet above the previous high watermark for flooding, and partly relied on federal flood maps to determine which stations are at most risk.
Brooks said Duke is not using weather events to justify routine projects, noting that the company had spent more than a year meeting with community stakeholders and using their feedback to make significant changes to its grid improvement plan.
This year, the North Carolina Utilities Commission finally approved a set of grid improvements that will cost customers $1.2 billion. But the commission reserved the right to deny Duke reimbursement of those costs if it cannot prove they are prudent and reasonable. The commission’s general counsel, Sam Watson, declined to discuss the decision, saying the commission can comment on specific cases only in public orders.
The utility is now burying power lines in “several neighborhoods across the state” that are most vulnerable to wide-scale outages, Brooks said. It is also fitting aboveground power lines with “self-healing” technology, a network of sensors that diverts electricity away from equipment failures to minimize the number of customers affected by an outage.
As part of a settlement with Vote Solar, Duke Energy last year agreed to work with state officials and local leaders to further evaluate the potential impacts of climate change, a process that Brooks said is expected to take two to three years.
High costs create hurdles
The debate in North Carolina is being echoed in states across the nation, where burying power lines has emerged as one of the most common proposals for insulating the grid from high winds, fires and flooding. But opponents have balked at the cost, which can run in the millions of dollars per mile.
In California, for example, Pacific Gas & Electric wants to bury 10,000 miles of power lines, both to make the grid more resilient and to reduce the risk of sparking wildfires. Its power equipment has contributed to multiple deadly wildfires in the past decade, including the 2018 Camp Fire that killed at least 85 people.
PG&E’s proposal has drawn scorn from critics, including San Jose Mayor Sam Liccardo, who say it would be too slow and expensive. But Patricia Poppe, the company’s CEO, told reporters that doing nothing would cost California even more in lost lives and property while struggling to keep the lights on during wildfires. The plan has yet to be submitted to the state, but Terrie Prosper, a spokeswoman for the California Public Utilities Commission, said the commission has supported underground lines as a wildfire mitigation strategy.
Another oft-floated solution is microgrids, small electrical systems that provide power to a single neighborhood, university or medical center. Most of the time, they are connected to a larger utility system. But in the event of an outage, microgrids can operate on their own, with the aid of solar energy stored in batteries.
In Florida, regulators recently approved a four-year microgrid pilot project, but the technology remains expensive and unproven. In Maryland, regulators in 2016 rejected a plan to spend about $16 million for two microgrids in Baltimore, in part because the local utility made no attempt to quantify “the tangible benefits to its customer base.”
Amid shut-off woes, a beacon of energy
In Texas, where officials have largely abandoned state regulation in favor of the free market, the results have been no more encouraging. Without requirements, as exist elsewhere, for building extra capacity for times of high demand or stress, the state was ill-equipped to handle an abnormal deep freeze in February that knocked out power to 4 million customers for days.
Since then, Berkshire Hathaway Energy and Starwood Energy Group each proposed spending $8 billion to build new power plants to provide backup capacity, with guaranteed returns on the investment of 9 percent, but the Texas legislature has not acted on either plan.
New York is one of the few states where regulators have assessed the risks of climate change and pushed utilities to invest in solutions. After 800,000 New Yorkers lost power for 10 days in 2012 in the wake of Hurricane Sandy, state regulators ordered utility giant Con Edison to evaluate the state’s vulnerability to weather events.
The resulting report, which estimated climate risks could cost the company as much as $5.2 billion by 2050, gave ConEd data to inform its investments in storm hardening measures, including new storm walls and submersible equipment in areas at risk of flooding.
Meanwhile, the New York Public Service Commission has aggressively enforced requirements that utility companies keep the lights on during big storms, fining utility providers nearly $190 million for violations including inadequate staffing during Tropical Storm Isaias in 2020.
“At the end of the day, we do not want New Yorkers to be at the mercy of outdated infrastructure,” said Rory M. Christian, who last month was appointed chair of the New York commission.
The price of inaction
In North Carolina, as Duke Energy slowly works to harden the grid, some are pursuing other means of fostering climate-resilient communities.
Beth Schrader, the recovery and resilience director for New Hanover County, which includes Wilmington, said some of the people who went the longest without power after Florence had no vehicles, no access to nearby grocery stores and no means of getting to relief centers set up around the city.
For example, Quanesha Mullins, a 37-year-old mother of three, went eight days without power in her housing project on Wilmington’s east side. Her family got by on food from the Red Cross and walked a mile to charge their phones at McDonald’s. With no air conditioning, they slept with the windows open in a neighborhood with a history of violent crime.
Schrader is working with researchers at the University of North Carolina in Charlotte to estimate the cost of helping people like Mullins. The researchers estimate that it would have cost about $572,000 to provide shelter, meals and emergency food stamp benefits to 100 families for two weeks, said Robert Cox, an engineering professor who researches power systems at UNC-Charlotte.
Such calculations could help spur local governments to do more to help vulnerable communities, for example by providing “resilience outposts” with backup power generators, heating or cooling rooms, Internet access and other resources, Schrader said. But they also are intended to show the costs of failing to shore up the grid.
“The regulators need to be moved along,” Cox said.
In the meantime, Tonye Gray finds herself worrying about what happens when the next storm hits. While Duke Energy says it is burying power lines in the most outage-prone areas, she has yet to see its yellow-vested crews turn up in her neighborhood.
“We feel,” she said, “that we’re at the end of the line.”
Related News