Trump NEPA Overhaul streamlines environmental reviews, tightening 'reasonably foreseeable' effects, curbing cumulative impacts, codifying CEQ greenhouse gas guidance, expediting permits for pipelines, highways, and wind projects with two-year EIS limits and one lead agency.
Key Points
Trump NEPA Overhaul streamlines reviews, trims cumulative impacts, keeps GHG analysis for foreseeable effects.
✅ Limits cumulative and indirect impacts; emphasizes foreseeable effects
✅ Caps EIS at two years; one-year environmental assessments
✅ One lead agency; narrower NEPA triggers for low federal funding
President Trump has announced plans for overhauling rules surrounding the nation’s bedrock environmental law, and administration officials refuted claims they were downplaying greenhouse gas emissions, as the administration also pursues replacement power plant rules in related areas.
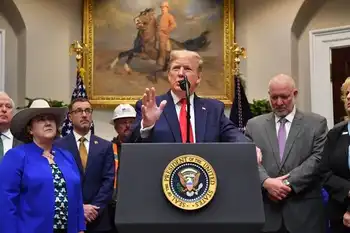
The president, during remarks at the White House with supporters and Cabinet officials, said he wanted to fix the nation’s “regulatory nightmare” through new guidelines for implementing the National Environmental Policy Act.
“America is a nation of builders,” he said. But it takes too long to get a permit, and that’s “big government at its absolute worst.”
The president said, “We’re maintaining America’s world-class standards of environmental protection.” He added, “We’re going to have very strong regulation, but it’s going to go very quickly.”
NEPA says the federal government must consider alternatives to major projects like oil pipelines, highways and bridges that could inflict environmental harm. The law also gives communities input.
The Council on Environmental Quality has not updated the implementing rules in decades, and both energy companies and environmentalists want them reworked, even as some industry groups warned against rushing electricity pricing changes under related policy debates.
But they patently disagree on how to change the rules.
A central fight surrounds whether the government considers climate change concerns when analyzing a project.
Environmentalists want agencies to look more at “cumulative” or “indirect” impacts of projects. The Trump plan shuts the door on that.
“Analysis of cumulative effects is not required,” the plan states, adding that CEQ “proposes to make amendments to simplify the definition of effects by consolidating the definition into a single paragraph.”
CEQ Chairwoman Mary Neumayr told reporters during a conference call that definitions in the current rules were the “subject of confusion.”
The proposed changes, she said, do in fact eliminate the terms “cumulative” and “indirect,” in favor of more simplified language.
Effects must be “reasonably foreseeable” and require a “reasonably close causal relationship” to the proposed action, she added. “It does not exclude considerations of greenhouse gas emissions,” she said, pointing to parallel EPA proposals for new pollution limits on coal and gas power plants as context.
Last summer, CEQ issued proposed guidance on greenhouse gas reviews in project permitting. The nonbinding document gave agencies broad authority when considering emissions (Greenwire, June 21, 2019).
Environmentalists scoffed and said the proposed guidance failed to incorporate the latest climate science and look at how projects could be more resilient in the face of severe weather and sea-level rise.
The proposed NEPA rules released today include provisions to codify the proposed guidance, which has also been years in the making.
Other provisions
Senior administration officials sought to downplay the effect of the proposed NEPA rules by noting the underlying statute will remain the same.
“If it required NEPA yesterday, it will require NEPA under the new proposal,” an official said when asked how the changes might apply to pipelines like Keystone XL.
And yet the proposed changes could alter the “threshold consideration” that triggers NEPA review. The proposal would exclude projects with minimal federal funding or “participation.”
The Trump plan also proposes restricting an environmental impact statement to two years and an environmental assessment to one.
Neumayr said the average EIS takes 4 ½ years and in some cases longer. Democrats have disputed those timelines. Further, just 1% of all federal actions require an EIS, they argue.
The proposal would also require one agency to take the lead on permitting and require agency officials to “timely resolve disputes that may result in delays.”
In general, the plan calls for environmental documents to be “concise” and “serve their purpose of informing decision makers.”
Both Interior Secretary David Bernhardt and EPA Administrator Andrew Wheeler, whose agency moved to rewrite coal power plant wastewater limits in separate actions, were at the White House for the announcement.
Reaction
An onslaught of critics have said changes to NEPA rules could be the administration’s most far-reaching environmental rollback, and state attorneys general have mounted a legal challenge to related energy actions as well.
The League of Conservation Voters declared the administration was again trying to “sell out the health and well-being of our children and families to corporate polluters.”
On Capitol Hill, House Speaker Nancy Pelosi (D-Calif.) said during a news conference the administration would “no longer enforce NEPA.”
“This means more polluters will be right there, next to the water supply of our children,” she said. “That’s a public health issue. Their denial of climate, they are going to not use the climate issue as anything to do with environmental decisionmaking.”
Sen. Sheldon Whitehouse (D-R.I.) echoed the sentiment, saying he didn’t need any more proof that the fossil fuel industry had hardwired the Trump administration “but we got it anyway.”
Energy companies, including firms focused on renewable energy development, are welcoming the “clarity” of the proposed NEPA rules, even as debates continue over a clean electricity standard in federal climate policy.
“The lack of clarity in the existing NEPA regulations has led courts to fill the gaps, spurring costly litigation across the sector, and has led to unclear expectations, which has caused significant and unnecessary delays for infrastructure projects across the country,” the Interstate Natural Gas Association of America said in a statement.
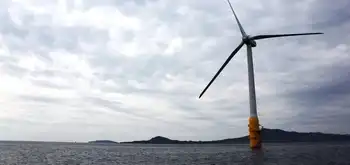
Last night, the American Wind Energy Association said NEPA rules have caused “unreasonable and unnecessary costs and long project delays” for land-based and offshore wind energy and transmission development.
Trump has famously attacked the wind energy industry for decades, dating back to his opposition to a Scottish wind turbine near his golf course.
The president today said he won’t stop until “gleaming new infrastructure has made America the envy of the world again.”
When asked whether he thought climate change was a “hoax,” as he once tweeted, he said no. “Nothing’s a hoax about that,” he said.
The president said there’s a book about climate he’s planning to read. He said, “It’s a very serious subject.”
Related News