BC-Alberta Transmission Intertie enables clean hydro to balance wind and solar, expanding transmission capacity so Site C hydro can dispatch power, cut emissions, lower costs, and accelerate electrification across provincial grids under federal climate policy.
Key Points
A cross-provincial grid link using BC hydro to firm Alberta wind and solar, cutting emissions and costs.
✅ Balances variable renewables with dispatchable hydro from Site C.
✅ Enables power trade: peak exports, low-cost wind imports.
✅ Lowers decarbonization costs and supports electrification goals.
By Mark Jaccard
Lost in the news and noise of the federal government's newly announced $170-per-tonne carbon tax was a single, critical sentence in Canada's updated climate plan, one that signals a strategy that could serve as the cornerstone for a future free of greenhouse gas emissions.
"The government will work with provinces and territories to connect parts of Canada that have abundant clean hydroelectricity with parts that are currently more dependent on fossil fuels for electricity generation — including by advancing strategic intertie projects."
Why do we think this one sentence is so important? And what has it got to do with the controversial Site C project Site C electricity debate under construction in British Columbia?
The answer lies in the huge amount of electricity we'll need to generate in Canada to achieve our climate goals for 2030 and 2050. Even while we aggressively pursue energy efficiency, our electric cars, buses and perhaps trucks in Canada's net-zero race will need a huge amount of new electricity, as will our buildings and industries.
Luckily, Canada is blessed with an electricity system that is the envy of the world — already over 80 per cent zero emission, the bulk being from flexible hydro-electricity, with a backbone of nuclear power largely in Ontario, a national electricity success and rapidly growing shares of cheap wind and solar.
Provincial differences
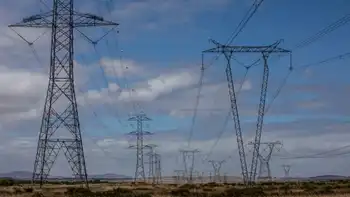
Yet the story differs significantly from one province to another. While B.C.'s electricity is nearly emissions free, the opposite is true of its neighbour, Alberta, where more than 80 per cent still comes from fossil fuels. This, despite an impressive shift away from coal power in recent years.
Now imagine if B.C. and Alberta were one province.
This might sound like the start of a bad joke, or a horror movie to some, but it's the crux of new research by a trio of energy economists who put a fine point on the value of such co-operation.
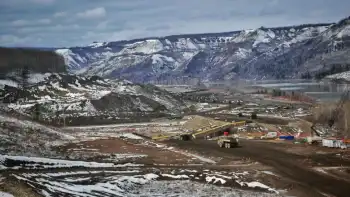
The study, by Brett Dolter, Kent Fellows and Nic Rivers, takes a detailed look at the economic case for completing Site C, BC Hydro's controversial large hydro project under construction, and makes three key conclusions.
First, they argue Site C should likely not have been started in the first place. Only a narrow set of assumptions can now justify its total cost. But what's done is done, and absent a time machine, the decision to complete the dam rests on go-forward costs.
On that note, their second conclusion is no more optimistic. Considering the cost to complete the project, even accounting for avoiding termination costs should it be cancelled, they find the economics of completing Site C over-budget status to be weak. If the New York Times had a Site C needle in the style of the newspaper's election visual, it would be "leaning cancel" at this point.
In Alberta, more than 80 per cent of the electricity still comes from fossil fuels, despite an impressive shift away from coal power in recent years. (CBC)
But it is their third conclusion that stands out as worthy of attention. They argue there is a case for completing Site C if the following conditions are met:
B.C. and Alberta reduce their electricity sector emissions by more than 75 per cent (this really means Alberta, given B.C.'s already clean position); and
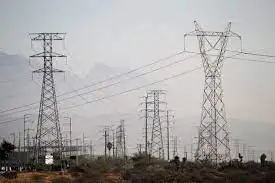
B.C. and Alberta expand their ability to move electricity between their respective provinces by building new transmission lines.
Let's deal with each of these in turn.
On Condition 1, we give an emphatic: YES! Reducing electricity emissions is an absolute must to meet climate pledges if Canada is to come even close to achieving its net-zero goals. As noted above, a clean electricity grid will be the cornerstone of a decarbonized economy as we generate a great deal more power to electrify everything from industrial processes to heating to transportation and more.
Condition 2 is more challenging. Talk of increasing transmission connections across Canada, including Hydro-Québec's U.S. strategy has been ongoing for over 50 years, with little success to speak of. But this time might well be different. And the implications for a completed Site C, should the government go that route, are profound.
Wind and solar costs rapidly declining
Somewhat ironically, the case for Site C is made stronger by the rapidly declining costs of two of its apparent renewable competitors: wind and solar.
The cost of wind and solar generation has fallen by 70 per cent and 90 per cent, respectively, a dramatic decline in the past 10 years. No longer can these variable sources of power be derided as high cost; they are unequivocally the cheapest sources of raw energy in electricity systems today.
However, electricity system operators must deal with their "non-dispatchability," a seemingly complicated term that simply means they produce electricity only when the sun shines and the wind blows, which is not necessarily when electricity customers want their electricity delivered (dispatched) to them. And because of this characteristic, the value of dispatchable electricity sources, like a completed Site C, will grow as a complement to wind and solar.
Thus, as Alberta's generation of cheap wind and solar grows, so too does the value of connecting it with the firm, dispatchable resources available in B.C.
Rather than displacing wind and solar, large hydro facilities with the ability to increase or decrease output on short notice can actually enable more investment in these renewable sources. Expanding the transmission connection, with Site C on one side of that line, becomes even more valuable.
Many in B.C. might read this and rightly ask themselves, why should we foot the bill for this costly project to help out Albertans? The answer is that it won't be charity — B.C. will get paid handsomely for the power it delivers in peak periods and will be able to import wind power at low prices from Alberta in other times. B.C. will benefit greatly from these gains of trade.
Turning to Alberta, why should Albertans support B.C. reaping these gains? The answer is two-fold.
First, Site C will actually enable more low-cost wind and solar to be built in Alberta due to hydro's ability to balance these non-dispatchable renewables. Jobs and economic opportunity will occur in Alberta from this renewable energy growth.
Second, while B.C. imports won't come cheap, they will be less costly than the decarbonization alternatives Alberta would need without B.C.'s flexible hydro, as the economists' study shows. This means lower overall costs to Alberta's power consumers.
A clear role for Ottawa
To be sure, there are challenges to increasing the connectedness of B.C. and Alberta's power systems, not least of which is BC Hydro being a regulated, government-owned monopoly while Alberta is a competitive market amongst private generators. Some significant accommodations in climate policy and grids will be needed to ensure both sides can compete and benefit from trade on an equal footing.
There is also the pesky matter of permitting and constructing thousands of kilometres of power lines. Getting linear energy infrastructure built in Canada has not exactly been our forte of late.
We are not naive to the significant challenges in such an approach, but it's not often that we see such a clear narrative for beneficial climate action that, when considered at the provincial level, is likely to be thwarted, but when considered more broadly can produce a big win.
It's the clearest example yet of a role for the federal government to bridge the gap, to facilitate the needed regulatory conversations, and, let's be frank, to bring money to the table to make the line happen. Neither provincial side is likely to do it on their own, nor, as history has shown, are they likely to do it together.
For a government committed to reducing emissions, and with a justified emphasis on the electricity sector, the opportunity to expand the Alberta-B.C. transmission intertie, leveraging the flexibility of B.C.'s hydro with the abundance of wind and solar potential on the Prairies, offers a potential massive decarbonization win for Western Canada that is too good to ignore.
Mark Jaccard, a professor at Simon Fraser University, and Blake Shaffer, a professor at the University of Calgary
Related News