China kicks nuclear builds into high gear

By Industrial Info Resources


Protective Relay Training - Basic

Our customized live online or in‑person group training can be delivered to your staff at your location.

  • Live Online
  • 12 hours Instructor-led
  • Group Training Available
Regular Price:
$699
Coupon Price:
$599
Reserve Your Seat Today
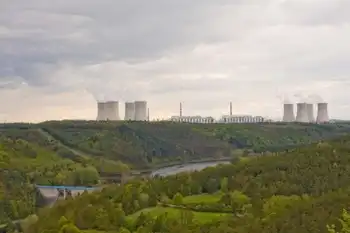
"It's expected that China will begin construction on six new nuclear power units in 2010," said Tian Jiashu, the director of the Nuclear and Radiation Safety Center for the Ministry of Environmental Protection, in a recent interview.

The six units have a total planned capacity of about 5,300 megawatts and are in Ningde, Fujian province Changjiang, Hainan province and Fangchenggang, Guangxi region.

So far, China has 11 nuclear power units in operation, with an installed capacity of 9.08 gigawatts GW, and 25 nuclear power units under construction, with an installed capacity of 15.1 GW. In addition, there are 18 units with an installed capacity of about 20.4 GW awaiting approval, including projects in places such as Tianwan, Jiangsu province Sanmen, Zhejiang province Haiyang, Shandong province Taohuajiang, Hunan province Xianning, Hubei province and Nanyang, Henan province.

The boom in nuclear power construction has moved far beyond original plans. So far, the total number of nuclear power units in operation, under construction and under planning has reached 60, and the installed capacity of these units has reached about 60 GW, which is 50 higher than the installed capacity planned for 2020 in the Middle and Long-term Development Plan for Nuclear Power 2005-20, which was issued in 2007.

"For this reason, China is working on the adjustment of the Middle and Long-term Development Plan for Nuclear Power," Tain said. In the next 10 years, China will begin construction of 8-GW nuclear power units every year, on average. It's expected that China's installed capacity of nuclear power will surpass 75 GW in operation, with more than 40 GW of units under construction in 2020.

Although the cost of nuclear power generation in China is higher than that of thermal power, if the localization rate of nuclear power reaches 70, the cost of nuclear power generation will be reduced to about $31 per megawatt-hour. "Following the increasing in localization rate and the expansion in scale, the cost of nuclear power will be largely reduced," Tian predicted.

Related News

Egypt's renewable energy to reach 6.6 GW by year-end

Egypt Renewable Energy Expansion targets solar and wind power projects to diversify the energy mix, adding 6.6 GW by 2020 and reaching 8,200 MW, with UK cooperation, grid upgrades, and investment in the electricity sector.


Key Points

A plan to boost solar and wind by 6.6 GW by 2020, reaching 8,200 MW and diversifying Egypt's energy mix.

✅ Adds 6.6 GW by 2020; targets 8,200 MW total capacity

✅ Focus on solar, wind, grid upgrades, and investment

✅ UK-Egypt cooperation in electricity sector projects


Egypt is planning to expand into renewable energy projects in a bid to increase its contribution to the energy mix, in step with global records being set in renewables, and amid Saudi Arabia’s 60 GW drive in the region, the country’s minister of electricity and renewable energy Mohamed Shaker said.

Renewable power is expected to add 6.6 gigawatts (GW) by the end of 2020, a scale comparable to Saudi wind expansion underway, with plans to reach 8,200 megawatts (MW) after the completion of the renewable energy projects currently under consideration, reflecting gains seen since IRENA’s 2016 record year for renewables, Shaker added in a statement on Tuesday, even as regional challenges persist.

This came during the minister’s video-conference meeting with the British ambassador to Egypt Geoffrey Adams to explore the potential means for cooperation between the two countries in the electricity sector, including lessons from the UK project backlog now affecting investments and from Ireland’s green-electricity goals being pursued.


Related News

View more

EIA expects solar and wind to be larger sources of U.S. electricity generation this summer

US Summer Electricity Outlook 2022 projects rising renewable energy generation as utility-scale solar and wind capacity additions surge, while coal declines and natural gas shifts amid higher fuel prices and regional supply constraints.


Key Points

An EIA forecast of summer 2022 power: more solar and wind, less coal, and shifting gas use amid higher fuel prices.

✅ Solar +10 million MWh; wind +8 million MWh vs last summer

✅ Coal generation -20 million MWh amid supply constraints, retirements

✅ Gas prices near $9/MMBtu; slight national gen decline


In our Summer Electricity Outlook, a supplement to our May 2022 Short-Term Energy Outlook, we expect the largest increases in U.S. electric power sector generation this summer will come from renewable energy sources such as wind and solar generation. These increases are the result of new capacity additions. We forecast utility-scale solar generation between June and August 2022 will grow by 10 million megawatthours (MWh) compared with the same period last summer, and wind generation will grow by 8 million MWh. Forecast generation from coal and natural gas declines by 26 million MWh this summer, although natural gas generation could increase in some electricity markets where coal supplies are constrained.

For recent context, overall U.S. power generation in January rose 9.3% year over year, the EIA reports.

Wind and solar power electric-generating capacity has been growing steadily in recent years. By the start of June, we estimate the U.S. electric power sector will have 65 gigawatts (GW) of utility-scale solar-generating capacity, a 31% increase in solar capacity since June 2021. Almost one-third of this new solar capacity will be built in the Texas electricity market. The electric power sector will also have an estimated 138 GW of wind capacity online this June, which is a 12% increase from last June.

Along with growth in renewables capacity, we expect that an additional 6 GW of new natural gas combined-cycle generating capacity will come online by June 2022, an increase of 2% from last summer. Despite this increase in capacity, we expect natural gas-fired electricity generation at the national level will be slightly (1.3%) lower than last summer.

We forecast the price of natural gas delivered to electric generators will average nearly $9 per million British thermal units between June and August 2022, which would be more than double the average price last summer. The higher expected natural gas prices and growth in renewable generation will likely lead to less natural gas-fired generation in some regions of the country.

In contrast to renewables and natural gas, the electricity industry has been steadily retiring coal-fired power plants over the past decade. Between June 2021 and June 2022, the electric power sector will have retired 6 GW (2%) of U.S. coal-fired generating capacity.

In previous years, higher natural gas prices would have resulted in more coal-fired electricity generation across the fleet. However, coal-fired power plants have been limited in their ability to replenish their historically low inventories in recent months as a result of mine closures, rail capacity constraints, and labor market tightness. These coal supply constraints, along with continued retirement of generating capacity, contribute to our forecast that U.S. coal-fired generation will decline by 20 million MWh (7%) this summer. In some regions of the country, these coal supply constraints may lead to increased natural gas-fired electricity generation despite higher natural gas prices.


Related News

View more

UK low-carbon electricity generation stalls in 2019

UK low-carbon electricity 2019 saw stalled growth as renewables rose slightly, wind expanded, nuclear output fell, coal hit record lows, and net-zero targets demand faster deployment to cut CO2 intensity below 100gCO2/kWh.


Key Points

Low-carbon sources supplied 54% of UK power in 2019, up just 1TWh; wind grew, nuclear fell, and coal dropped to 2%.

✅ Wind up 8TWh; nuclear down 9TWh amid outages

✅ Fossil fuels 43% of generation; coal at 2%

✅ Net-zero needs 15TWh per year added to 2030


The amount of electricity generated by low-carbon sources in the UK stalled in 2019, Carbon Brief analysis shows.

Low-carbon electricity output from wind, solar, nuclear, hydro and biomass rose by just 1 terawatt hour (TWh, less than 1%) in 2019. It represents the smallest annual increase in a decade, where annual growth averaged 9TWh. This growth will need to double in the 2020s to meet UK climate targets while replacing old nuclear plants as they retire.

Some 54% of UK electricity generation in 2019 came from low-carbon sources, including 37% from renewables and 20% from wind alone, underscoring wind's leading role in the power mix during key periods. A record-low 43% was from fossil fuels, with 41% from gas and just 2% from coal, also a record low. In 2010, fossil fuels generated 75% of the total.

Carbon Brief’s analysis of UK electricity generation in 2019 is based on figures from BM Reports and the Department for Business, Energy and Industrial Strategy (BEIS). See the methodology at the end for more on how the analysis was conducted.

The numbers differ from those published earlier in January by National Grid, which were for electricity supplied in Great Britain only (England, Wales and Scotland, but excluding Northern Ireland), including via imports from other countries.

Low-carbon low
In 2019, the UK became the first major economy to target net-zero greenhouse gas emissions by 2050, increasing the ambition of its legally binding Climate Change Act.

To date, the country has cut its emissions by around two-fifths since 1990, with almost all of its recent progress coming from the electricity sector.

Emissions from electricity generation have fallen rapidly in the decade since 2010 as coal power has been almost phased out and even gas output has declined. Fossil fuels have been displaced by falling demand and by renewables, such as wind, solar and biomass.

But Carbon Brief’s annual analysis of UK electricity generation shows progress stalled in 2019, with the output from low-carbon sources barely increasing compared to a year earlier.

The chart below shows low-carbon generation in each year since 2010 (grey bars) and the estimated level in 2019 (red). The pale grey bars show the estimated future output of existing low-carbon sources after old nuclear plants retire and the pale red bars show the amount of new generation needed to keep electricity sector emissions to less than 100 grammes of CO2 per kilowatt hour (gCO2/kWh), the UK’s nominal target for the sector.

 Annual electricity generation in the UK by fuel, terawatt hours, 2010-2019. Top panel: fuel by fuel. Bottom panel: cumulative total generation from all sources. Source: BEIS energy trends, BM Reports and Carbon Brief analysis. Chart by Carbon Brief using Highcharts.
As the chart shows, the UK will require significantly more low-carbon electricity over the next decade as part of meeting its legally binding climate goals.

The nominal 100gCO2/kWh target for 2030 was set in the context of the UK’s less ambitious goal of cutting emissions to 80% below 1990 levels by 2050. Now that the country is aiming to cut emissions to net-zero by 2050, that 100gCO2/kWh indicator is likely to be the bare minimum.

Even so, it would require a rapid step up in the pace of low-carbon expansion, compared to the increases seen over the past decade. On average, low-carbon generation has risen by 9TWh each year in the decade since 2010 – including a rise of just 1TWh in 2019.

Given scheduled nuclear retirements and rising demand expected by the Committee on Climate Change (CCC) – with some electrification of transport and heating – low-carbon generation would need to increase by 15TWh each year until 2030, just to meet the benchmark of 100gCO2/kWh.

For context, the 3.2 gigawatt (GW) Hinkley C new nuclear plant being built in Somerset will generate around 25TWh once completed around 2026. The world’s largest offshore windfarm, the 1.2GW Hornsea One scheme off the Yorkshire coast, will generate around 5TWh each year.

The new Conservative government is targeting 40GW of offshore wind by 2030, up from today’s figure of around 8GW. If policies are put in place to meet this goal, then it could keep power sector emissions below 100gCO2/kWh, depending on the actual performance of the windfarms built.

However, new onshore wind and solar, further new nuclear or other low-carbon generation, such as gas with carbon capture and storage (CCS), is likely to be needed if demand is higher than expected, or if the 100gCO2/kWh benchmark is too weak in the context of net-zero by 2050.

The CCC says it is “likely” to “reflect the need for more rapid deployment” of low-carbon towards net-zero emissions in its advice on the sixth UK carbon budget for 2033-2037, due in September.

Trading places
Looking more closely at UK electricity generation in 2019, Carbon Brief’s analysis shows why there was so little growth for low-carbon sources compared to the previous year.

There was another increase for wind power in 2019 (up 8TWh, 14%), with record wind generation as several large new windfarms were completed including the 1.2GW Hornsea One project in October and the 0.6GW Beatrice offshore windfarm in Q2 of 2019. But this was offset by a decline for nuclear (down 9TWh, 14%), due to ongoing outages for reactors at Hunterston in Scotland and Dungeness in Kent.

(Analysis of data held by trade organisation RenewableUK suggests some 0.6GW of onshore wind capacity also started operating in 2019, including the 0.2GW Dorenell scheme in Moray, Scotland.)

As a result of these movements, the UK’s windfarms overtook nuclear for the first time ever in 2019, becoming the country’s second-largest source of electricity generation, and earlier, wind and solar together surpassed nuclear in the UK as momentum built. This is shown in the figure below, with wind (green line, top panel) trading places with nuclear (purple) and gas (dark blue) down around 25% since 2010 but remaining the single-largest source.

 Annual electricity generation in the UK by fuel, terawatt hours, 2010-2019. Top panel: fuel by fuel. Bottom panel: cumulative total generation from all sources. Source: BEIS energy trends, BM Reports and Carbon Brief analysis. Chart by Carbon Brief using Highcharts.
The UK’s currently suspended nuclear plants are due to return to service in January and March, according to operator EDF, the French state-backed utility firm. However, as noted above, most of the UK’s nuclear fleet is set to retire during the 2020s, with only Sizewell B in Suffolk due to still be operating by 2030. Hunterston is scheduled to retire by 2023 and Dungeness by 2028.

Set against these losses, the UK has a pipeline of offshore windfarms, secured via “contracts for difference” with the government, at a series of auctions. The most recent auction, in September 2019, saw prices below £40 per megawatt hour – similar to current wholesale electricity prices.

However, the capacity contracted so far is not sufficient to meet the government’s target of 40GW by 2030, meaning further auctions – or some other policy mechanism – will be required.

Coal zero
As well as the switch between wind and nuclear, 2019 also saw coal fall below solar for the first time across a full year, echoing the 2016 moment when wind outgenerated coal across the UK, after it suffered another 60% reduction in electricity output. Just six coal plants remain in the UK, with Aberthaw B in Wales and Fiddlers Ferry in Cheshire closing in March.

Coal accounted for just 2% of UK generation in 2019, a record-low coal share since centralised electricity supplies started to operate in 1882. The fuel met 40% of UK needs as recently as 2012, but has plummeted thanks to falling demand, rising renewables, cheaper gas and higher CO2 prices.

The reduction in average coal generation hides the fact that the fuel is now often not required at all to meet the UK’s electricity needs. The chart below shows the number of days each year when coal output was zero in 2019 (red line) and the two previous years (blue).

 Cumulative number of days when UK electricity generation from renewable sources has been higher than that from fossil fuels. Source: BEIS energy trends, BM Reports and Carbon Brief analysis. Chart by Carbon Brief using Highcharts.
The 83 days in 2019 with zero coal generation amount to nearly a quarter of the year and include the record-breaking 18-day stretch without the fuel.

Great Britain has been running for a record TWO WEEKS without using coal to generate electricity – the first time this has happened since 1882.

The country’s grid has been coal-free for 45% of hours in 2019 so far.https://www.carbonbrief.org/countdown-to-2025-tracking-the-uk-coal-phase-out …

Coal generation was set for significant reductions around the world in 2019 – including a 20% reduction for the EU as a whole – according to analysis published by Carbon Brief in November.

Notably, overall UK electricity generation fell by another 9TWh in 2019 (3%), bringing the total decline to 58TWh since 2010. This is equivalent to more than twice the output from the Hinkley C scheme being built in Somerset. As Carbon Brief explained last year, falling demand has had a similar impact on electricity-sector CO2 emissions as the increase in output from renewables.

This is illustrated by the fact that the 9TWh reduction in overall generation translated into a 9TWh (6%) cut in fossil-fuel generation during 2019, with coal falling by 10TWh and gas rising marginally.

Increasingly renewable
As fossil-fuel output and overall generation have declined, the UK’s renewable sources of electricity have continued to increase. Their output has risen nearly five-fold in the past decade and their share of the UK total has increased from 7% in 2010 to 37% in 2019.

As a result, the UK’s increasingly renewable grid is seeing more minutes, hours and days during which the likes of wind, solar and biomass collectively outpace all fossil fuels put together, and on some days wind is the main source as well.

The chart below shows the number of days during each year when renewables generated more electricity than fossil fuels in 2019 (red line) and each of the previous four years (blue lines). In total, nearly two-fifths of days in 2019 crossed this threshold.

 Cumulative number of days when the UK has not generated any electricity from coal. Source: BEIS energy trends, BM Reports and Carbon Brief analysis. Chart by Carbon Brief using Highcharts.
There were also four months in 2019 when renewables generated more of the UK’s electricity than fossil fuels: March, August, September and December. The first ever such month came in September 2018 and more are certain to follow.

National Grid, which manages Great Britain’s high-voltage electricity transmission network, is aiming to be able to run the system without fossil fuels by 2025, at least for short periods. At present, it sometimes has to ask windfarm operators to switch off and gas plants to start running in order to keep the electricity grid stable.

Note that biomass accounted for 11% of UK electricity generation in 2019, nearly a third of the total from all renewables. Some two-thirds of the biomass output is from “plant biomass”, primarily wood pellets burnt at Lynemouth in Northumberland and the Drax plant in Yorkshire. The remainder was from an array of smaller sites based on landfill gas, sewage gas or anaerobic digestion.

The CCC says the UK should “move away” from large-scale biomass power plants, once existing subsidy contracts for Drax and Lynemouth expire in 2027.

Using biomass to generate electricity is not zero-carbon and in some circumstances could lead to higher emissions than from fossil fuels. Moreover, there are more valuable uses for the world’s limited supply of biomass feedstock, the CCC says, including carbon sequestration and hard-to-abate sectors with few alternatives.

Methodology
The figures in the article are from Carbon Brief analysis of data from BEIS Energy Trends chapter 5 and chapter 6, as well as from BM Reports. The figures from BM Reports are for electricity supplied to the grid in Great Britain only and are adjusted to include Northern Ireland.

In Carbon Brief’s analysis, the BM Reports numbers are also adjusted to account for electricity used by power plants on site and for generation by plants not connected to the high-voltage national grid. This includes many onshore windfarms, as well as industrial gas combined heat and power plants and those burning landfill gas, waste or sewage gas.

By design, the Carbon Brief analysis is intended to align as closely as possible to the official government figures on electricity generated in the UK, reported in BEIS Energy Trends table 5.1.

Briefly, the raw data for each fuel is in most cases adjusted with a multiplier, derived from the ratio between the reported BEIS numbers and unadjusted figures for previous quarters.

Carbon Brief’s method of analysis has been verified against published BEIS figures using “hindcasting”. This shows the estimates for total electricity generation from fossil fuels or renewables to have been within ±3% of the BEIS number in each quarter since Q4 2017. (Data before then is not sufficient to carry out the Carbon Brief analysis.)

For example, in the second quarter of 2019, a Carbon Brief hindcast estimates gas generation at 33.1TWh, whereas the published BEIS figure was 34.0TWh. Similarly, it produces an estimate of 27.4TWh for renewables, against a BEIS figure of 27.1TWh.

National Grid recently shared its own analysis for electricity in Great Britain during 2019 via its energy dashboard, which differs from Carbon Brief’s figures.


Related News

View more

Europe's Worst Energy Nightmare Is Becoming Reality

European Energy Crisis shocks markets as Russia slashes gas via Nord Stream, spiking prices and triggering rationing, LNG imports, storage shortfalls, and emergency measures to secure energy security before a harsh winter.


Key Points

Europe-wide gas shock from reduced Russian flows drives price spikes, rationing risk, LNG reliance, and emergency action.

✅ Nord Stream cuts deepen supply insecurity and storage gaps

✅ LNG imports rise but terminal capacity and shipping are tight

✅ Policy tools: rationing, subsidies, demand response, coal restarts


As Russian gas cutoffs upend European energy security, the continent is struggling to cope with what experts say is one of its worst-ever energy crises—and it could still get much worse. 

For months, European leaders have been haunted by the prospect of losing Russia’s natural gas supply, which accounts for some 40 percent of European imports and has been a crucial energy lifeline for the continent. That nightmare is now becoming a painful reality as Moscow slashes its flows in retaliation for Europe’s support for Ukraine, dramatically increasing energy prices and forcing many countries to resort to emergency plans, including emergency measures to limit electricity prices in some cases, and as backup energy suppliers such as Norway and North Africa are failing to step up.

“This is the most extreme energy crisis that has ever occurred in Europe,” said Alex Munton, an expert on global gas markets at Rapidan Energy Group, a consultancy. “Europe [is] looking at the very real prospect of not having sufficient gas when it’s most needed, which is during the coldest part of the year.”

“Prices have shot through the roof,” added Munton, who noted that European natural gas prices—nearly $50 per MMBTu—have eclipsed U.S. price rises by nearly tenfold, and that rolling back electricity prices is tougher than it appears in the current market. “That is an extraordinarily high price to be paying for natural gas, and really there is no immediate way out from here.” 

Many officials and energy experts worry that the crisis will only deepen after Nord Stream 1, the largest gas pipeline from Russia to Europe, is taken down for scheduled maintenance this week. Although the pipeline is supposed to be under repair for only 10 days, the Kremlin’s history of energy blackmail and weaponization has stoked fears that Moscow won’t turn it back on—leaving heavily reliant European countries in the lurch. (Russia’s second pipeline to Germany, Nord Stream 2, was killed in February as Russian President Vladimir Putin prepared to invade Ukraine, leaving Nord Stream 1 as the biggest direct gas link between Russia and Europe’s biggest economy.)

“Everything is possible. Everything can happen,” German economy minister Robert Habeck told Deutschlandfunk on Saturday. “It could be that the gas flows again, maybe more than before. It can also be the case that nothing comes.”

That would spell trouble for the upcoming winter, when demand for energy surges and having sufficient natural gas is necessary for heating. European countries typically rely on the summer months to refill their gas storage facilities. And at a time of war, when the continent’s future gas supply is uncertain, having that energy cushion is especially crucial.

If Russia’s prolonged disruptions continue, experts warn of a difficult winter: one of potential rationing, industrial shutdowns, and even massive economic dislocation. British officials, who just a few months ago warned of soaring power bills for consumers, are now warning of even worse, despite a brief fall to pre-Ukraine war levels in gas prices earlier in the year.

Europe could face a “winter of discontent,” said Helima Croft, a managing director at RBC Capital Markets. “Rationing, industrial shut-ins—all of that is looming.”

Unrest has already been brewing, with strikes erupting across the continent as households struggle under the pressures of spiraling costs of living and inflationary pressures. Some of this discontent has also had knock-on effects in the energy market. In Norway, the European Union’s biggest supplier of natural gas after Russia, mass strikes in the oil and gas industries last week forced companies to shutter production, sending further shockwaves throughout Europe.

European countries are at risk of descending into “very, very strong conflict and strife because there is no energy,” Frans Timmermans, the vice president of the European Commission, told the Guardian. “Putin is using all the means he has to create strife in our societies, so we have to brace ourselves for a very difficult period.”

The pain of the crisis, however, is perhaps being felt most clearly in Germany, which has been forced to turn to a number of energy-saving measures, including rationing heated water and closing swimming pools. To cope with the crunch, Berlin has already entered the second phase of its three-stage emergency gas plan; last week, it also moved to bail out its energy giants amid German utility troubles that have been financially slammed by Russian cutoffs. 

But it’s not just Germany. “This is happening all across Europe,” said Olga Khakova, an expert on European energy security at the Atlantic Council, who noted that France has also announced plans to nationalize the EDF power company as it buckles under mounting economic losses, and the EU outlines gas price cap strategies to temper volatility. “The challenging part is how much can these governments provide in support to their energy consumers, to these companies? And what is that breaking point?”

The situation has also complicated many countries’ climate goals, even as some call it a wake-up call to ditch fossil fuels for Europe. In late June, Germany, Italy, Austria, and the Netherlands announced they would restart old coal power plants as they grapple with shrinking supplies. 

The potential outcomes that European nations are grappling with reveal how this crisis is occurring on a scale that has only been seen in times of war, Munton said. In the worst-case scenario, “we’re talking about rationing gas supplies, and this is not something that Europe has had to contend with in any other time than the wartime,” he said. “That’s essentially where things have got to now. This is an energy war.”

They also underscore the long and painful battle that Europe will continue to face in weaning itself off Russian gas. Despite the continent’s eagerness to leave Moscow’s supply behind, experts say Europe will likely remain trapped in this spiraling crisis until it can develop the infrastructure for greater energy independence—and that could take years. U.S. gas, shipped by tanker, is one option, but that requires new terminals to receive the gas and U.S. energy impacts remain a factor for policymakers. New pipelines take even longer to build—and there isn’t a surfeit of eligible suppliers.

Until then, European leaders will continue to scramble to secure enough supplies—and can only hope for mild weather. The “worst-case scenario is people having to choose between eating and heating come winter,” Croft said. 


Related News

View more

Customers on the hook for $5.5 billion in deferred BC Hydro operating costs: report

BC Hydro Deferred Regulatory Assets detail $5.5 billion in costs under rate-regulated accounting, to be recovered from ratepayers, highlighting B.C. Utilities Commission oversight, audit scrutiny, financial reporting impacts, and public utility governance.


Key Points

BC Hydro defers costs as regulatory assets to recover from ratepayers, influencing rates and financial reporting.

✅ $5.5B in deferred costs recorded as net regulatory assets

✅ Rate impacts tied to B.C. Utilities Commission oversight

✅ Auditor General to assess accounting and governance


Auditor General Carol Bellringer says BC Hydro has deferred $5.5 billion in expenses that it plans to recover from ratepayers in the future, as rates to rise by 3.75% over two years.

Bellringer focuses on the deferred expenses in a report on the public utility's use of rate-regulated accounting to control electricity rates for customers.

"As of March 31, 2018, BC Hydro reported a total net regulatory asset of $5.455 billion, which is what ratepayers owe," says the report. "BC Hydro expects to recover this from ratepayers in the future. For BC Hydro, this is an asset. For ratepayers, this is a debt."

She says rate-regulated accounting is used widely across North America, but cautions that Hydro has largely overridden the role of the independent B.C. Utilities Commission to regulate rates.

"We think it's important for the people of B.C. and our members of the legislative assembly to better understand rate-regulated accounting in order to appreciate the impact it has on the bottom line for BC Hydro, for government as a whole, for ratepayers and for taxpayers, especially following a three per cent rate increase in April 2018," Bellringer said in a conference call with reporters.

Last June, the B.C. government launched a two-phase review of BC Hydro to find cost savings and look at the direction of the Crown utility, amid calls for change from advocates.

The review came shortly after a planned government rate freeze was overturned by the utilities commission, which resulted in a three per cent rate increase in April 2018.

A statement by BC Hydro and the government says a key objective of the review due this month is to enhance the regulatory oversight of the commission.

Bellringer's office will become BC Hydro's auditor next year — and will be assessing the impact of regulation on the utility's financial reporting.

"It is a complex area and confidence in the regulatory system is critical to protect the public interest," wrote Bellringer.


Related News

View more

Does Providing Electricity To The Poor Reduce Poverty? Maybe Not

Rural Electrification Poverty Impact examines energy access, grid connections, and reliability, testing economic development claims via randomized trials; findings show minimal gains without appliances, reliable supply, and complementary services like education and job creation initiatives.


Key Points

Study of household grid connections showing modest poverty impact without reliable power and appliances.

✅ Randomized grid connections showed no short-term income gains.

✅ Low reliability and few appliances limited electricity use.

✅ Complementary investments in jobs, education, health may be needed.


The head of Swedfund, the development finance group, recently summarized a widely-held belief: “Access to reliable electricity drives development and is essential for job creation, women’s empowerment and combating poverty.” This view has been the driving force behind a number of efforts to provide electricity to the 1.1 billion people around the world living in energy poverty, such as India's village electrification initiatives in recent years.

But does electricity really help lift households out of poverty? My co-authors and I set out to answer this question. We designed an experiment in which we first identified a sample of “under grid” households in Western Kenya—structures that were located close to but not connected to a grid. These households were then randomly divided into treatment and control groups. In the treatment group, we worked closely with the rural electrification agency to connect the households to the grid for free or at various discounts. In the control group, we made no changes. After eighteen months, we surveyed people from both groups and collected data on an assortment of outcomes, including whether they were employed outside of subsistence agriculture (the most common type of work in the region) and how many assets they owned. We even gave children basic tests, as a frequent assertion is that electricity helps children perform better in school since they are able to study at night.

When we analyzed the data, we found no differences between the treatment and control groups. The rural electrification agency had spent more than $1,000 to connect each household. Yet eighteen months later, the households we connected seemed to be no better off. Even the children’s test scores were more or less the same. The results of our experiment were discouraging, and at odds with the popular view that supplying households with access to electricity will drive economic development. Lifting people out of poverty may require a more comprehensive approach to ensure that electricity is not only affordable (with some evidence that EV growth can benefit all customers in mature markets), but is also reliable, useable, and available to the whole community, paired with other important investments.

For instance, in many low-income countries, the grid has frequent blackouts and maintenance problems, making electricity unreliable, as seen in Nigeria's electricity crisis in recent years. Even if the grid were reliable, poor households may not be able to afford the appliances that would allow for more than just lighting and cell phone charging. In our data, households barely bought any appliances and they used just 3 kilowatt-hours per month. Compare that to the U.S. average of 900 kilowatt-hours per month, a figure that could rise as EV adoption increases electricity demand over time.

There are also other factors to consider. After all, correlation does not equal causation. There is no doubt that the 1.1 billion people without power are the world’s poorest citizens. But this is not the only challenge they face. The poor may also lack running water, basic sanitation, consistent food supplies, quality education, sufficient health care, political influence, and a host of other factors that may be harder to measure but are no less important to well-being. Prioritizing investments in some of these other factors may lead to higher immediate returns. Previous work by one of my co-authors, for example, shows substantial economic gains from government spending on treatment for intestinal worms in children.

It’s possible that our results don’t generalize. They certainly don’t apply to enhancing electricity services for non-residential customers, like factories, hospitals, and schools, and electric utilities adapting to new load patterns. Perhaps the households we studied in Western Kenya are particularly poor (although measures of well-being suggest they are comparable to rural households across Sub-Saharan Africa) or politically disenfranchised. Perhaps if we had waited longer, or if we had electrified an entire region, the household impacts we measured would have been much greater. But others who have studied this question have found similar results. One study, also conducted in Western Kenya, found that subsidizing solar lamps helped families save on kerosene, but did not lead children to study more. Another study found that installing solar-powered microgrids in Indian villages resulted in no socioeconomic benefits.


Related News

View more

Sign Up for Electricity Forum’s Newsletter

Stay informed with our FREE Newsletter — get the latest news, breakthrough technologies, and expert insights, delivered straight to your inbox.

Electricity Today T&D Magazine Subscribe for FREE

Stay informed with the latest T&D policies and technologies.
  • Timely insights from industry experts
  • Practical solutions T&D engineers
  • Free access to every issue

Live Online & In-person Group Training

Advantages To Instructor-Led Training – Instructor-Led Course, Customized Training, Multiple Locations, Economical, CEU Credits, Course Discounts.

Request For Quotation

Whether you would prefer Live Online or In-Person instruction, our electrical training courses can be tailored to meet your company's specific requirements and delivered to your employees in one location or at various locations.