Canada among world's largest consumers

By Vancouver Sun


Electrical Testing & Commissioning of Power Systems

Our customized live online or in‑person group training can be delivered to your staff at your location.

  • Live Online
  • 12 hours Instructor-led
  • Group Training Available
Regular Price:
$599
Coupon Price:
$499
Reserve Your Seat Today
Candles? Check. Flashlight? Check. Did you celebrate Earth Hour? Great.

While you were sitting in the dark, let's shine a light on how much of the planet's resources you've been using up.

At 8:30 on the evening of March 28, city streets faded to black as thousands of communities took part in the global rallying cry for the environment — casting the City of Light into shadow and swathing the Acropolis in blackness.

"We want to make visible what is so often invisible, which is people's desire to do something to halt climate change,"said Keith Stewart, manager of climate change for the World Wild-life Fund (WWF) Canada, which co-ordinated the event.

Turning off lights and appliances is an environmentally friendly way to call for action on climate change. But even when the lights go out, your impact on the environment continues. From the refrigerator humming in the kitchen to the furnace in the basement and the car parked in your driveway, your ecological footprint is taking a toll on the planet.

The ecological footprint represents your impact on the environment. It calculates how much land would be needed to produce all the resources you consume and absorb all the waste you dump back into the environment.

Canadians are among the world's greediest resource-gobblers. Canada has the world's seventh-largest ecological footprint per capita, after the United Arab Emirates, United States, Kuwait, Denmark, Australia and New Zealand.

According to the World Wildlife Fund's 2008 Living Planet Report, Canadians' average footprint is 7.1 global hectares.

The Earth's carrying capacity is 1.8 hectares per person, meaning we are in "overshoot"—spending the Earth's natural capital at a pace that threatens our very survival. The average global footprint is 2.7 hectares.

The footprints of Canadian cities range from a high of 9.9 for Calgary to a low of 6.9 for Sudbury, according to a 2004 survey by the Federation of Canadian Municipalities.

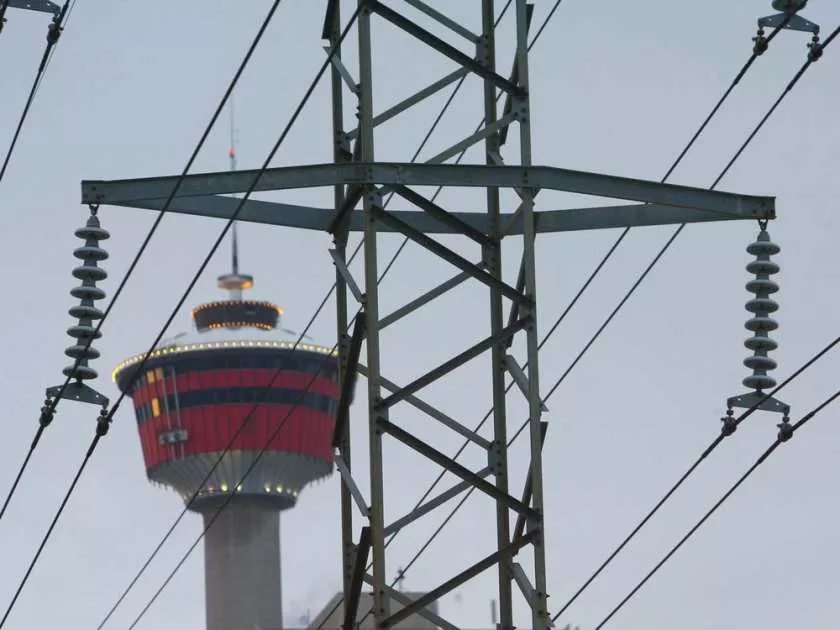
Calgary's footprint is highest because of C02 emissions from Alberta's oil and gas industry, dependence on coal for electricity, higher disposable income and car-centred transportation, according to Hans Messinger, a research adviser at Statistics Canada.

About 70 per cent of your footprint is determined by factors over which you have little control, such as availability of public transit, said Meredith Stechbart, a project manager with the Global Footprint Network in Oakland, Calif.

"If you're in L. A. and you have to drive everywhere, that locks you into a certain category of footprint," she said. Government and local services like water supply, mail delivery and financial services together account for 26 per cent of your footprint.

However, lifestyle choices regarding transportation, diet and housing can make a significant difference, according to Bill Rees, the University of British Columbia professor who originated the concept of the ecological footprint.

Do you commute by car or walk and cycle everywhere, for instance? Do you eat a lot of red meat or eat mostly vegetables, preferably organic? Do you live in a sprawling house or a compact, energy-efficient condo or row house?

"There's no question the biggest thing people can do is to reduce their carbon output and the biggest contributor to that is the car," Rees says.

Transportation represents 17 per cent of the average Canadian's footprint, said Stechbart.

Car travel makes up 80 per cent of the typical footprint. Twenty per cent is from the manufacture of your vehicle and 60 per cent from driving it.

Food makes up 24 per cent of our footprint. Environmentalists have long urged us to choose organic, local products. But Canadians have no choice but to eat imported food in winter. And recent studies suggest foods shipped by sea have a lower footprint than produce trucked from closer to home, because trucking has a higher carbon footprint.

Our homes are better insulated than 20 years ago, but Rees said we still have a long way to go.

Home heating accounts for 60 per cent of residential energy use, according to Statistics Canada, and represents 15 per cent of our total footprint. Choose a smaller dwelling in a dense neighbourhood and make it as airtight as possible, Rees counseled. And buy the most energy-efficient appliances you can find.

"We're discounters. We want to save $100, so we don't buy the most efficient model. The point is it would pay for itself."

Related News

DOE Announces $34 Million to Improve America?s Power Grid

DOE GOPHURRS Grid Undergrounding accelerates ARPA-E innovations to modernize the power grid, boosting reliability, resilience, and security via underground power lines, AI-driven surveying, robotic tunneling, and safer cable splicing for clean energy transmission and distribution.


Key Points

A DOE-ARPA-E program funding undergrounding tech to modernize the grid and improve reliability and security.

✅ $34M for 12 ARPA-E projects across 11 states

✅ Underground power lines to boost reliability and resilience

✅ Robotics, AI, and safer splicing to cut costs and risks


The U.S. Department of Energy (DOE) has earmarked $34 million for 12 innovative projects across 11 states to bolster and modernize the nation’s power grid, complementing efforts like a Washington state infrastructure grant announced to strengthen resilience.

Under the Grid Overhaul with Proactive, High-speed Undergrounding for Reliability, Resilience, and Security (GOPHURRS) program, this funding is focused on developing efficient and secure undergrounding technologies. The initiative is aligned with President Biden’s vision to strengthen America's energy infrastructure and advance smarter electricity infrastructure priorities, thereby creating jobs, enhancing energy and national security, and advancing towards a 100% clean electricity grid by 2035.

U.S. Secretary of Energy Jennifer M. Granholm emphasized the criticality of modernizing the power grid to facilitate a future powered by clean energy, including efforts to integrate more solar into the grid nationwide, thus reducing energy costs and bolstering national security. This development, she noted, is pivotal in bringing the grid into the 21st Century.

The U.S. electric power distribution system, comprising over 5.5 million line miles and over 180 million power poles, is increasingly vulnerable to weather-related damage, contributing to a majority of annual power outages. Extreme weather events, intensified by climate change impacts across the nation, exacerbate the frequency and severity of these outages. Undergrounding power lines is an effective measure to enhance system reliability for transmission and distribution grids.

Managed by DOE’s Advanced Research Projects Agency-Energy (ARPA-E), the newly announced projects include contributions from small and large businesses, national labs, and universities. These initiatives are geared towards developing technologies that will lower costs, expedite undergrounding operations, and enhance safety. Notable projects involve innovations like Arizona State University’s water-jet construction tool for deploying electrical cables underground, GE Vernova Advanced Research’s robotic worm tunnelling construction tool, and Melni Technologies’ redesigned medium-voltage power cable splice kits.

Other significant projects include Oceanit’s subsurface sensor system for avoiding utility damage during undergrounding and Pacific Northwest National Laboratory’s AI system for processing geophysical survey data. Prysmian Cables and Systems USA’s project focuses on a hands-free power cable splicing machine to improve network reliability and workforce safety, complementing state efforts like California's $500 million grid investment to upgrade infrastructure.

Complete descriptions of these projects can be found on the ARPA-E website, while a recent grid report card highlights challenges these efforts aim to address.

ARPA-E’s mission is to advance clean energy technologies with high potential and impact, playing a strategic role in America’s energy security, including military preparedness for grid cyberattacks as a priority. This commitment ensures the U.S. remains a global leader in developing and deploying advanced clean energy technologies.


Related News

View more

Scottish Wind Delivers Equivalent Of 98% Of Country’s October Electricity Demand

Scotland Wind Energy October saw renewables supply the equivalent of 98 percent of electricity demand, as onshore wind outpaced National Grid needs, cutting emissions and powering households, per WWF Scotland and WeatherEnergy.


Key Points

A monthly update showing Scottish onshore wind met the equivalent of 98% of electricity demand in October.

✅ 98% of monthly electricity demand equivalent met by wind

✅ 16 days exceeded total national demand, per data

✅ WWF Scotland and WeatherEnergy cited; lower emissions


New figures publicized by WWF Scotland have revealed that wind energy generated the equivalent of 98% of the country’s electricity demand in October, or enough electricity to power millions of Scottish homes across the country.

Scotland has regularly been highlighted as a global wind energy leader, and over the last few years has repeatedly reported record-breaking months for wind generation. Now, it’s all very well and good to say that Scottish wind delivered 98% of the country’s electricity demand, but the specifics are a little different — hence why WWF Scotland always refers to it as wind providing “the equivalent of 98%” of Scotland’s electricity demand. That’s why it’s worth looking at the statistics provided by WWF Scotland, sourced from WeatherEnergy, part of the European EnergizAIR project:

  • National Grid demand for the month – 1,850,512 MWh
  • What % of this could have been provided by wind power across Scotland – 98%
  • Best day – 23rd October 2018, generation was 105,900.94 MWh, powering 8.72m homes, 356% of households. Demand that day was 45,274.5MWh – wind generation was 234% of that.
  • Worst day – 18th October 2018 when generation was 18,377.71MWh powering 1,512,568 homes, 62% of households. Demand that day was 73,628.5MWh – wind generation was 25%
  • How many days generation was over 100% of households – 27
  • How many days generation was over 100% of demand – 16

“What a month October proved to be, with wind powering on average 98 per cent of Scotland’s entire electricity demand for the month, at a time when wind became the UK’s main power source and exceeding our total demand for a staggering 16 out of 31 days,” said Dr Sam Gardner, acting director at WWF Scotland.

“These figures clearly show wind is working, it’s helping reduce our emissions and is the lowest cost form of new power generation. It’s also popular, with a recent survey also showing more and more people support turbines in rural areas. That’s why it’s essential that the UK Government unlocks market access for onshore wind at a time when we need to be scaling up electrification of heat and transport.”

Alex Wilcox Brooke, Weather Energy Project Manager at Severn Wye Energy Agency, added: “Octobers figures are a prime example of how reliable & consistent wind production can be, with production on 16 days outstripping national demand.”


Related News

View more

If B.C. wants to electrify all road vehicles by 2055, it will need to at least double its power output: study

B.C. EV Electrification 2055 projects grid capacity needs doubling to 37 GW, driven by electric vehicles, renewable energy expansion, wind and solar generation, limited natural gas, and policy mandates for zero-emission transportation.


Key Points

A projection that electrifying all B.C. road transport by 2055 would more than double grid demand to 37 GW.

✅ Site C adds 1.1 GW; rest from wind, solar, limited natural gas.

✅ Electricity price per kWh rises 9%, but fuel savings offset.

✅ Significant GHG cuts with 93% renewable grid under Clean Energy Act.


Researchers at the University of Victoria say that if B.C. were to shift to electric power for all road vehicles by 2055, the province would require more than double the electricity now being generated.

The findings are included in a study to be published in the November issue of the Applied Energy journal.

According to co-author and UVic professor Curran Crawford, the team at the university's Pacific Institute for Climate Solutions took B.C.'s 2015 electrical capacity of 15.6 gigawatts as a baseline, and added projected demands from population and economic growth, then added the increase that shifting to electric vehicles would require, while acknowledging power supply challenges that could arise.

They calculated the demand in 2055 would amount to 37 gigawatts, more than double 15.6 gigawatts used in 2015 as a baseline, and utilities warn of a potential EV charging bottleneck if demand ramps up faster than infrastructure.

"We wanted to understand what the electricity requirements are if you want to do that," he said. "It's possible — it would take some policy direction."

B.C. announces $4M in rebates for home and work EV charging stations across the province
The team took the planned Site C dam project into account, but that would only add 1.1 gigawatts of power. So assuming no other hydroelectric dams are planned, the remainder would likely have to come from wind and solar projects and some natural gas.

"Geothermal and biomass were also in the model," said Crawford, adding that they are more expensive electricity sources. "The model we were using, essentially, we're looking for the cheapest options."
Wind turbines on the Tantramar Marsh between Nova Scotia and New Brunswick tower over the Trans-Canada Highway. If British Columbia were to shift to 100 per cent electric-powered ground transportation by 2055, the province would have to significantly increase its wind and solar power generation. (Eric Woolliscroft/CBC)
The electricity bill, per kilowatt hour, would increase by nine per cent, according to the team's research, but Crawford said getting rid of the gasoline and diesel now used to fuel vehicles could amount to an overall cost saving, especially when combined with zero-emission vehicle incentives available to consumers.

The province introduced a law this year requiring that all new light-duty vehicles sold in B.C. be zero emission by 2040, while the federal 2035 EV mandate adds another policy signal, so the researchers figured 2055 was a reasonable date to imagine all vehicles on the road to be electric.

Crawford said hydrogen-powered vehicles weren't considered in the study, as the model used was already complicated enough, but hydrogen fuel would actually require more electricity for the electrolysis, when compared to energy stored in batteries.

Electric vehicles are approaching a tipping point as faster charging becomes more available — here's why
The study also found that shifting to all-electric ground transportation in B.C. would also mean a significant decrease in greenhouse gas emissions, assuming the Clean Energy Act remains in place, which mandates that 93 per cent of grid electricity must come from renewable resources, whereas nationally, about 18 per cent of electricity still comes from fossil fuels, according to 2019 data. 

"Doing the electrification makes some sense — If you're thinking of spending some money to reduce carbon emissions, this is a pretty cost effective way of doing that," said Crawford.


Related News

View more

U.S. offshore wind power about to soar

US Offshore Wind Lease Sales signal soaring renewable energy growth, drawing oil and gas developers, requiring BOEM auctions, seismic surveying, transmission planning, with $70B investment, 8 GW milestones, and substantial job creation in coastal communities.


Key Points

BOEM-run auctions granting areas for offshore wind, spurring projects, investment, and jobs in federal waters.

✅ $70B investment needed by 2030 to meet current demand

✅ 8 GW early buildout could create 40,000 US jobs

✅ Requires BOEM auctions, seismic surveying, transmission corridors


Recent offshore lease sales demonstrate that not only has offshore wind arrived in the U.S., but it is clearly set to soar, as forecasts point to a $1 trillion global market in the coming decades. The level of participation today, especially from seasoned offshore oil and gas developers, exemplifies that the offshore industry is an advocate for the 'all of the above' energy portfolio.

Offshore wind could generate 160,000 direct, indirect and induced jobs, with 40,000 new U.S. jobs with the first 8 gigawatts of production, while broader forecasts see a quarter-million U.S. wind jobs within four years.

In fact, a recent report from the Special Initiative on Offshore Wind (SIOW), said that offshore wind investment in U.S. waters will require $70 billion by 2030 just based on current demand, and the UK's rapid scale-up offers a relevant benchmark.

Maintaining this tremendous level of interest from offshore wind developers requires a reliable inventory of regularly scheduled offshore wind sales and the ability to develop those resources. Coastal communities and extreme environmental groups opposing seismic surveying and the issuance of incidental harassment authorizations under the Marine Mammal Protection Act may literally take the wind out of these sales. Just as it is for offshore oil and gas development, seismic surveying is vital for offshore wind development, specifically in the siting of wind turbines and transmission corridors.

Unfortunately, a long-term pipeline of wind lease sales does not currently exist. In fact, with the exception of a sale proposed offshore New York offshore wind or potentially California in 2020, there aren't any future lease sales scheduled, leaving nothing upon which developers can plan future investments and prompting questions about when 1 GW will be on the grid nationwide.

NOIA is dedicated to working with the Bureau of Ocean Energy Management and coastal communities, consumers, energy producers and other stakeholders, drawing on U.K. wind lessons where applicable, in working through these challenges to make offshore wind a reality for millions of Americans.


Related News

View more

Miami Valley Expands EV Infrastructure with 24 New Chargers

Miami Valley EV Chargers Expansion strengthens Level 2 charging infrastructure across Dayton, with Ohio EPA funding and Volkswagen settlement support, easing range anxiety and promoting sustainable transportation at Austin Landing and high-traffic destinations.


Key Points

An Ohio initiative installing 24 Level 2 stations to boost EV adoption, reduce range anxiety, and expand access in Dayton.

✅ 24 new Level 2 chargers at high-traffic regional sites

✅ Ohio EPA and VW settlement funds support deployment

✅ Reduces range anxiety, advancing sustainable mobility


The Miami Valley region in Ohio is accelerating its transition to electric vehicles (EVs) with the installation of 24 new Level 2 EV chargers, funded through a $1.1 million project supported by the Ohio Environmental Protection Agency (EPA). This initiative aims to enhance EV accessibility and alleviate "range anxiety" among drivers as the broader U.S. EV boom tests grid readiness.

Strategic Locations Across the Region

The newly installed chargers are strategically located in high-traffic areas to maximize their utility as national charging networks compete to expand coverage across travel corridors. Notable sites include Austin Landing, the Dayton Art Institute, the Oregon District, Caesar Creek State Park, and the Rose Music Center. These locations were selected to ensure that EV drivers have convenient access to charging stations throughout the region, similar to how Ontario streamlines station build-outs to place chargers where drivers already travel.

Funding and Implementation

The project is part of Ohio's broader effort to expand EV infrastructure, reflecting the evolution of U.S. charging infrastructure while utilizing funds from the Volkswagen Clean Air Act settlement. The Ohio EPA awarded approximately $3.25 million statewide for the installation of Level 2 EV chargers, with the Miami Valley receiving a significant portion of this funding, while Michigan utility programs advance additional investments to scale regional infrastructure.

Impact on the Community

The expansion of EV charging infrastructure is expected to have several positive outcomes. It will provide greater convenience for current EV owners and encourage more residents to consider electric vehicles as a viable transportation option, including those in apartments and condos who benefit from expanded access. Additionally, the increased availability of charging stations supports the state's environmental goals by promoting the adoption of cleaner, more sustainable transportation.

Looking Ahead

As the adoption of electric vehicles continues to grow, the Miami Valley's investment in EV infrastructure positions the region as a leader in sustainable transportation as utilities pursue ambitious charging strategies to meet demand. The success of this project may serve as a model for other regions looking to expand their EV charging networks. This initiative reflects a significant step towards a more sustainable and accessible transportation future for the Miami Valley.


Related News

View more

Energy UK - Switching surge continues

UK Energy Switching Surge sees 600,000 customers change suppliers in October, driven by competition, the Energy Switch Guarantee, and better tariffs, with Electralink's DTN supporting customer switching and Ofgem oversight.


Key Points

A rise in UK customers switching electricity suppliers in October, driven by competition and the Energy Switch Guarantee.

✅ 600,000 switches recorded in October

✅ 32% moved to small and mid-tier suppliers

✅ Energy Switch Guarantee assures simple, safe transfers


More than 600,000 customers took steps to save on their energy bills this winter by switching electricity provider in October, as forecasts such as a 16% bill decrease in April offer further encouragement, the latest figures from Energy UK reveal.

A third (32 per cent) of those changing providers in October moved to small and mid-tier suppliers.

Regional markets have seen changes too, including Irish electricity price increases that highlight wider cost pressures.

With recent research showing that that nine in ten energy switchers were happy with the process of changing suppliers and with the reassurance provided by the Energy Switch Guarantee - a series of commitments ensuring switches are simple, speedy and safe - and amid MPs proposing price restrictions to protect consumers, more and more customers are now confident when looking to move.

Lawrence Slade, chief executive of Energy UK said: 'Switching continues to surge with over 600,000 customers changing supplier to find a better deal last month. Many more will have made savings by checking they are on the best deal with their current supplier. It only takes a few minutes to do this and with over 55 suppliers across the market, there's never been more competition or choice.'

Around 75 per cent of the market are signatories of the Guarantee. This includes: British Gas, Bulb Energy, E.ON, EDF Energy, First Utility, Flow Energy, npower, Octopus Energy, Pure Planet, Sainsbury's Energy, Scottish Power, So Energy and Tonik Energy.

The switching data is supplied by Electralink who provides a secure service to transfer data between the electricity market participants. The company operates the Data Transfer Network (DTN) which underpins customer switching, meter interoperability and other business processes critical to a competitive electricity market, where knowing where your electricity comes from can support informed choices.

The data referenced in these reports is since our collection of data only and is for electricity only.

These figures do not include internal electricity switching, and statistics on this from the larger suppliers and on Standard Variable Tariffs can be viewed on the Ofgem website, while ministers consider ending the gas-electricity price link to reduce bills.


Related News

View more

Sign Up for Electricity Forum’s Newsletter

Stay informed with our FREE Newsletter — get the latest news, breakthrough technologies, and expert insights, delivered straight to your inbox.

Electricity Today T&D Magazine Subscribe for FREE

Stay informed with the latest T&D policies and technologies.
  • Timely insights from industry experts
  • Practical solutions T&D engineers
  • Free access to every issue

Download the 2025 Electrical Training Catalog

Explore 50+ live, expert-led electrical training courses –

  • Interactive
  • Flexible
  • CEU-cerified