NorthWestern to have energy storage system

By Mass High Tech Business News


NFPA 70e Training

Our customized live online or in‑person group training can be delivered to your staff at your location.

  • Live Online
  • 6 hours Instructor-led
  • Group Training Available
Regular Price:
$199
Coupon Price:
$149
Reserve Your Seat Today
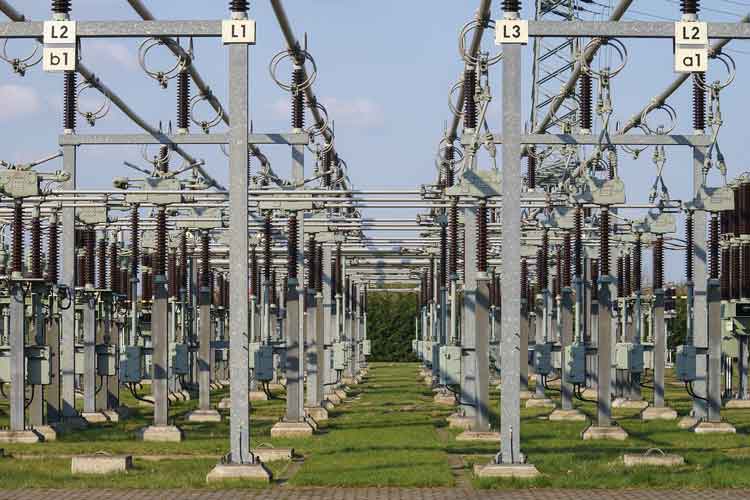
Beacon Power Corp. has reached an agreement to build its first energy storage system for a utility customer, the company said.

The Tyngsborough-based company, a maker of “flywheel” power storage systems, said it will build a 1-megawatt storage system for NorthWestern Energy in Montana, expected to be operational by the end of the year.

The flywheel systems provide frequency regulation service, which helps to stabilize the electric grid by balancing power supply levels during moment-to-moment variations in demand.

Beacon Power has built its other energy storage facilities for grid operators in New York and Massachusetts. The Montana project is “the first tangible result of the second part of our business model, the sale or lease of plants and systems to vertically integrated utilities, i.e., those that must self-provide frequency regulation,” Beacon spokesman Gene Hunt wrote in an email.

NorthWestern Energy will lease the system from Beacon for $500,000 for the first 15 months and for the same amount for future 15-month terms. NorthWestern also has the option to buy the facility for $4 million at any point, Beacon said.

The facility will be located on the site of the Mill Creek Generating Station, a gas-fired regulating reserve plant owned by NorthWestern Energy in Anaconda, Mont.

Related News

California faces huge power cuts as wildfires rage

California Wildfire Power Shut-Offs escalate as PG&E imposes blackouts amid high winds, Getty and Kincade fires, mass evacuations, Sonoma County threats, and a state of emergency, drawing regulatory scrutiny over grid safety and outage scope.


Key Points

Planned utility outages to curb wildfire risk during extreme winds, prompting evacuations and regulatory scrutiny.

✅ PG&E preemptive blackouts under regulator inquiry

✅ Getty and Kincade fires drive mass evacuations

✅ Sonoma County under threat amid high winds


Pacific Gas & Electric (PG&E) already faces an investigation by regulators after cutting supplies to 970,000 homes and businesses amid California blackouts that raised concerns.

It announced that another 650,000 properties would face precautionary shut-offs.

Wildfires fanned by the strong winds are raging in two parts of the state.

Thousands of residents near the wealthy Brentwood neighbourhood of Los Angeles have been told to evacuate because of a wildfire that began early on Monday.

Further north in Sonoma County, a larger fire has forced 180,000 people from their homes.

California's governor has declared a state-wide emergency.


What about the power cuts?

On Monday regulators announced a formal inquiry into whether energy utilities broke rules by pre-emptively cutting power to an estimated 2.5 million people, amid a blackouts policy debate that intensified, as wildfire risks soared.

They did not name any utilities but analysts said PG&E was responsible for the bulk of the "public safety power shut-offs", and later faced a Camp Fire guilty plea that underscored its liabilities.

The company filed for bankruptcy in January after facing hundreds of lawsuits from victims of wildfires in 2017 and 2018.

Of the 970,000 properties hit by the most recent cuts, under half had their services back by Monday, and some sought help through wildfire assistance programs, the Associated Press reported.

Despite criticism that the precautionary blackouts were too widespread and too disruptive, PG&E said more would come on Tuesday and Wednesday because further strong winds were expected.

The company said it had logged more than 20 preliminary reports of damage to its network from the most recent windstorm.

In a video posted to Twitter on Saturday, Governor Gavin Newsom said the power cuts were "infuriating everyone, and rightfully so".


Where are the fires now?

In Los Angeles, the Getty Fire has burned over 600 acres (242 ha) and about 10,000 buildings are in the mandatory evacuation zone.

At least eight homes have been destroyed and five others damaged.

"If you are in an evacuation zone, don't screw around," Mr Schwarzenegger tweeted. "Get out."

LA fire chief Ralph Terrazas said fire crews had been "overwhelmed" by the scale of the fires.

"They had to make some tough decisions on which houses they were able to protect," he said.

"Many times it depends on where the ember lands. I saw homes that were adjacent to homes that were totally destroyed, without any damage."

In northern California, schools remain closed in Sonoma County, where tens of thousands of homes and businesses are under threat.

Sonoma has been ravaged by the Kincade Fire, which started on Wednesday and has burned through 50,000 acres of land, fanned by the winds.

The Kincade Fire began seven minutes after a nearby power line was damaged, and power lines may have started fires according to reports, but PG&E has not yet confirmed if the power glitch started the blaze.

About 180,000 people have been ordered to evacuate, with roads around Santa Rosa north of San Francisco packed with cars as people tried to flee.

There are fears the flames could cross the 101 highway and enter areas that have not seen wildfires since the 1940s.


Related News

View more

Data Show Clean Power Increasing, Fossil Fuel Decreasing in California

California clean electricity accelerates with renewables as solar and wind surge, battery storage strengthens grid resilience, natural gas declines, and coal fades, advancing SB 100 targets, carbon neutrality goals, and affordable, reliable power statewide.


Key Points

California clean electricity is the state's transition to renewable, zero-carbon power, scaling solar, wind and storage.

✅ Solar generation up nearly 20x since 2012

✅ Natural gas power down 20%; coal nearly phased out

✅ Battery storage shifts daytime surplus to evening demand


Data from the California Energy Commission (CEC) highlight California’s continued progress toward building a more resilient grid, achieving 100 percent clean electricity and meeting the state’s carbon neutrality goals.

Analysis of the state’s Total System Electric Generation report shows how California’s power mix has changed over the last decade. Since 2012:

Solar generation increased nearly twentyfold from 2,609 gigawatt-hours (GWh) to 48,950 GWh.

  • Wind generation grew by 63 percent.
  • Natural gas generation decreased 20 percent.
  • Coal has been nearly phased-out of the power mix, and renewable electricity surpassed coal nationally in 2022 as well.

In addition to total utility generation, rooftop solar increased by 10 times generating 24,309 GWh of clean power in 2022. The state’s expanding fleet of battery storage resources also help support the grid by charging during the day using excess renewable power for use in the evening.

“This latest report card showing how solar energy boomed as natural gas powered electricity experienced a steady 20 percent decline over the last decade is encouraging,” said CEC Vice Chair Siva Gunda. “Even as climate impacts become increasingly severe, California remains committed to transitioning away from polluting fossil fuels and delivering on the promise to build a future power grid that is clean, reliable and affordable.”

Senate Bill 100 (2018) requires 100 percent of California’s electric retail sales be supplied by renewable and zero-carbon energy sources by 2045. To keep the state on track, last year Governor Gavin Newsom signed SB 1020, establishing interim targets of 90 percent clean electricity by 2035 and 95 percent by 2040.

The state monitors progress through the Renewables Portfolio Standard (RPS), which tracks the power mix of retail sales, and regional peers such as Nevada's RPS progress offer useful comparison. The latest data show that in 2021 more than 37 percent of the state’s electricity came from RPS-eligible sources such as solar and wind, an increase of 2.7 percent compared to 2020. When combined with other sources of zero-carbon energy such as large hydroelectric generation and nuclear, nearly 59 percent of the state’s retail electricity sales came from nonfossil fuel sources.

The total system electric generation report is based on electric generation from all in-state power plants rated 1 megawatt (MW) or larger and imported utility-scale power generation. It reflects the percentage of a specific resource compared to all power generation, not just retail sales. The total system electric generation report accounts for energy used for water conveyance and pumping, transmission and distribution losses and other uses not captured under RPS.


Related News

View more

Electricity use actually increased during 2018 Earth Hour, BC Hydro

Earth Hour BC highlights BC Hydro data on electricity use, energy savings, and participation in the Lower Mainland and Vancouver Island amid climate change and hydroelectric power dynamics.


Key Points

BC observance tracking BC Hydro electricity use and conservation during Earth Hour, amid hydroelectric power dominance.

✅ BC Hydro reports rising electricity use during Earth Hour 2018

✅ Savings fell from 2% in 2008 to near zero province-wide

✅ Hydroelectric grid yields low GHG emissions in BC


For the first time since it began tracking electricity use in the province during Earth Hour, BC Hydro said customers used more power during the 60-minute period when lights are expected to dim, mirroring all-time high electricity demand seen recently.

The World Wildlife Fund launched Earth Hour in Sydney, Australia in 2007. Residents and businesses there turned off lights and non-essential power as a symbol to mark the importance of combating climate change.

The event was adopted in B.C. the next year and, as part of that, BC Hydro began tracking the megawatt hours saved.

#google#

In 2008, residents and businesses achieved a two per cent savings in electricity use. But since then, BC Hydro says the savings have plummeted.

The event was adopted in B.C. the next year and, as part of that, BC Hydro began tracking the megawatt hours saved.

In 2008, residents and businesses achieved a two per cent savings in electricity use. But since then, BC Hydro says the savings have plummeted, as record-breaking demand in 2021 and beyond changed consumption patterns.


Lights on

For Earth Hour this year, which took place 8:30-9:30 p.m. on March 24, BC Hydro says electricity use in the Lower Mainland increased by 0.5 per cent, even as it activated a winter payment plan to help customers manage bills. On Vancouver Island it increased 0.6 per cent.

In the province's southern Interior and northern Interior, power use remained the same during the event.

On Friday, the utility released a report called: "lights out". Why Earth Hour is dimming in BC. which explores the decline of energy savings related to Earth Hour in the province.

The WWF says the way in which hydro companies track electricity savings during Earth Hour is not an accurate measure of participation, and tracking of emerging loads like crypto mining electricity use remains opaque, and noted that more countries than ever are turning off lights for the event.

For 2018, the WWF shifted the focus of Earth Hour to the loss of wildlife across the globe.

BC Hydro says in its report that the symbolism of Earth Hour is still important to British Columbians, but almost all power generation in B.C. is hydroelectric, though recent drought conditions have required operational adjustments, and only accounts for one per cent of greenhouse gas emissions.


Related News

View more

U.S. Electricity Sales Projections Continue to Fall

US Electricity Demand Outlook examines EIA forecasts, GDP decoupling, energy efficiency, electrification, electric vehicles, grid load growth, and weather variability to frame long term demand trends and utility planning scenarios.


Key Points

An analysis of EIA projections showing demand decoupling from GDP, with EV adoption and efficiency shaping future grid load.

✅ EIA lowers load growth; demand decouples from GDP.

✅ Efficiency and sector shifts depress kWh sales.

✅ EV adoption could revive load and capacity needs.


Electricity producers and distributors are in an unusual business. The product they provide is available to all customers instantaneously, literally at the flip of a switch. But the large amount of equipment, both hardware and software to do this takes years to design, site and install.

From a long range planning perspective, just as important as a good engineering design is an accurate sales projections. For the US electric utility industry the most authoritative electricity demand projec-tions come from the Department of Energy’s Energy Information Administration (EIA). EIA's compre-hensive reports combine econometric analysis with judgment calls on social and economic trends like the adoption rate of new technologies that could affect future electricity demand, things like LED light-ing and battery powered cars, and the rise of renewables overtaking coal in generation.

Before the Great Recession almost a decade ago, the EIA projected annual growth in US electricity production at roughly 1.5 percent per year. After the Great Recession began, the EIA lowered its projections of US electricity consumption growth to below 1 percent. Actual growth has been closer to zero. While the EIA did not antici-pate the last recession or its aftermath, we cannot fault them on that.

After the event, though, the EIA also trimmed its estimates of economic growth. For the 2015-2030 period it now predicts 2.1 percent economic and 0.3 percent electricity growth, down from previously projections of 2.7 percent and 1.3 percent respectively. (See Figures 1 and 2.)


Table 1. EIA electric generation projections by year of forecast (kWh billions)


Table 2. EIA forecast of GDP by year of forecast (billion 2009 $)

Back in 2007, the EIA figured that every one percent increase in economic activity required a 0.48 percent in-crease in electric generation to support it. By 2017, the EIA calculated that a 1 percent growth in economic activity now only required a 0.14 percent increase in electric output. What accounts for such a downgrade or disconnect between electricity usage and economic growth? And what factors might turn the numbers 
around?

First, the US economy lost energy intensive heavy industry like smelting, steel mills and refineries; patterns in China's electricity sector highlight how industrial shifts can reshape power demand. A more service oriented economy (think health care) relies more heavily on the movement of data or information and uses far less power than a manufacturing-oriented economy.

A small volcano in Argentina is about to fuel the next tech boom – and a little known company is going to be right at the center. Early investors stand to gain incredible profits and you can too. Read the report.

Second, internet shopping has hurt so-called "brick and mortar" retailers. Despite the departure of heavy industry, in years past a burgeoning US commercial sector increased its demand and usage of electricity to offset the industrial decline. But not anymore. Energy efficiency measures as well as per-haps greater concern about global warming and greenhouse gas emissions and have cut into electricity sales. “Do more with less” has the right ring to it.

But there may be other components to the ongoing decline in electricity usage. Academic studies show that electricity usage seems to increase with income along an S curve, and flattens out after a certain income level. That is, if you earn $1 billion per year you do not (or cannot) use ten times a much electricity as someone earning only $100 million.

But people at typical, middle income levels increase or decrease electricity usage when incomes rise or fall. The squeeze on middle income families was discussed often in the late presidential campaign. In recent decades an increasing percentage of income has gone to a small percentage of the population at the top of the income scale. This trend probably accounts for some weakness in residential sales. This suggests that government policy addressing income inequality would also boost electricity sales.

Population growth affects demand for electricity as well as the economy as a whole. The EIA has made few changes in its projections, showing 0.7 percent per year population growth in 2015- 2030 in both the 2007 and 2017 forecasts. Recent studies, however, have shown a drop in the birth rate to record lows. More troubling, from a national health perspective is that the average age of death may have stopped rising. Those two factors point to lower population growth, especially if the government also restricts immi-gration. Thus, the US may be approaching a period of rather modest population growth.

All of the above factors point to minimal sales growth for electricity producers in the US--perhaps even lower than the seemingly conservative EIA estimates. But the cloud on the horizon has a silver lining in the shape of an electric car. Both the United Kingdom and France have set dates to end of production of automobiles with internal combustion engines. Several European car makers have declared that 20 percent of their output will be electric vehicles by the early 2020s. If we adopt automobiles powered by electricity and not gasoline or diesel, electricity sales would increase by one third. For the power indus-try, electric vehicles represent the next big thing.

We don’t pretend to know how electric car sales will progress. But assume vehicle turnover rates re-main at the current 7 percent per year and electric cars account for 5 percent of sales in the first five years (as op-posed to 1 percent now), 20 percent in the next five years and 50 percent in the third five year period. Wildly optimistic assumptions? Maybe. By 2030, electric cars would constitute 28 percent of the vehicle fleet. They would add about 10 percent to kilowatt hour sales by that date, assuming that battery efficiencies do not improved by then. Those added sales would require increased electric generation output, with low-emissions sources expected to cover almost all the growth globally. They would also raise long term growth rates for 2015-2030 from the present 0.3 percent to 1.0 percent. The slow upturn in demand should give the electric companies time to gear up so to speak.

In the meantime, weather will continue to play a big role in electricity consumption. Record heat-induced demand peaks are being set here in the US even as surging global demand puts power systems under strain worldwide.

Can we discern a pattern in weather conditions 15 years out? Maybe we can, but that is one topic we don’t expect a government agency to tackle in public right now. Meantime, weather will affect sales more than anything else and we cannot predict the weather. Or can we?


Related News

View more

Wind Power Surges in U.S. Electricity Mix

U.S. Wind Power 2025 drives record capacity additions, with FERC data showing robust renewable energy growth, IRA incentives, onshore and offshore projects, utility-scale generation, grid integration, and manufacturing investment boosting clean electricity across key states.


Key Points

Overview of record wind additions, IRA incentives, and grid expansion defining the U.S. clean electricity mix in 2025.

✅ FERC: 30.1% of new U.S. capacity in Jan 2025 from wind

✅ Major projects: Cedar Springs IV, Boswell, Prosperity, Golden Hills

✅ IRA incentives drive onshore, offshore builds and manufacturing


In early 2025, wind power has significantly strengthened its position in the United States' electricity generation portfolio. According to data from the Federal Energy Regulatory Commission (FERC), wind energy accounted for 30.1% of the new electricity capacity added in January 2025, and as the most-used renewable source in the U.S., it also surpassed the previous record set in 2024. This growth is attributed to substantial projects such as the 390.4 MW Cedar Springs Wind IV and the 330.0 MW Boswell Wind Farm in Wyoming, along with the 300.0 MW Prosperity Wind Farm in Illinois and the 201.0 MW Golden Hills Wind Farm Expansion in Oregon. 

The expansion of wind energy capacity is part of a broader trend where solar and wind together accounted for over 98% of the new electricity generation capacity added in the U.S. in January 2025. This surge is further supported by the federal government's Inflation Reduction Act (IRA) and broader policy support for renewables, which has bolstered incentives for renewable energy projects, leading to increased investments and the establishment of new manufacturing facilities. 

By April 2025, clean electricity sources, including wind and solar, were projected to surpass 51% of total utility-scale electricity generation in the U.S., building on a 25.5% renewable share seen in recent data, marking a significant milestone in the nation's energy transition. This achievement is attributed to a combination of factors: a seasonal drop in electricity demand during the spring shoulder season, increased wind speeds in key areas like Texas, and higher solar production due to longer daylight hours and expanded capacity in states such as California, Arizona, and Nevada, supported by record installations across the solar and storage industry. 

Despite a 7% decline in wind power production in early April compared to the same period in 2024—primarily due to weaker wind speeds in regions like Texas—the overall contribution of wind energy remained robust, supported by an 82% clean-energy pipeline that includes wind, solar, and batteries. This resilience underscores the growing reliability of wind power as a cornerstone of the U.S. electricity mix. 

Looking ahead, the U.S. Department of Energy projects that wind energy capacity will continue to grow, with expectations of adding between 7.3 GW and 9.9 GW in 2024, and potentially increasing to 14.5 GW to 24.8 GW by 2028. This growth is anticipated to be driven by both onshore and offshore wind projects, with onshore wind representing the majority of new additions, continuing a trajectory since surpassing hydro capacity in 2016 in the U.S.

Early 2025 has witnessed a notable increase in wind power's share of the U.S. electricity generation mix. This trend reflects the nation's ongoing commitment to expanding renewable energy sources, especially after renewables surpassed coal in 2022, supported by favorable policies and technological advancements. As the U.S. continues to invest in and develop wind energy infrastructure, the role of wind power in achieving a cleaner and more sustainable energy future becomes increasingly pivotal.


Related News

View more

Transmission constraints impede incremental Quebec-to-US power deliveries

Hydro-Québec Northeast Clean Energy Transmission delivers surplus hydropower via HVDC interconnections to New York and New England, leveraging long-term contracts and projects like CHPE and NECEC to support carbon-free goals, GHG cuts, and grid reliability.


Key Points

An initiative to expand HVDC links for Quebec hydropower exports, aiding New York and New England decarbonization.

✅ 37,000 MW hydro capacity enables firm, low-carbon exports

✅ Targets NY and NE via CHPE, NECEC, and upgraded interfaces

✅ Backed by long-term PPAs to reduce merchant transmission risk


With roughly 37,000 MW of installed hydro power capacity, Quebec has ample spare capacity that it would like to deliver into Northeastern US markets where ambitious clean energy goals have been announced, but expanding transmission infrastructure is challenging.

Register Now New York recently announced a goal of receiving 100% carbon-free energy by 2040 and the New England states all have ambitious greenhouse gas reduction goals, including a Massachusetts law requiring GHG emissions be 80% below 1990 levels by 2050.

The province-owned company, Hydro Quebec, supplies power to the provinces of Quebec, Ontario and New Brunswick in particular, as well as sending electricity directly into New York and New England. The power transmission interconnections between New York and New England have reached capacity and in order to increase export volumes into the US, "we need to build more transmission infrastructure," Gary Sutherland, relationship manager in business development, recently said during a presentation to reporters in Montreal.


TRANSMISSION OPTIONS

Hydro Quebec is working with US transmission developers, electric distribution companies, independent system operators and state government agencies to expand that transmission capacity in order to delivery more power from its hydro system to the US, as the province has closed the door on nuclear power and continues to prioritize hydropower, Sutherland said.

The company is looking to sign long-term power supply contracts that could help alleviate some of the investment risk associated with these large infrastructure projects.

"It`s interesting to recall that in the 1980s, two decade-long contracts paved the way for construction of Phase II of the multi-terminal direct-current system (MTDCS), a cross-border line that delivers up to 2,000 MW from northern Quebec to New England," Hydro Quebec spokeswoman Lynn St-Laurent said in an email.

Long-term prices have been persistently low since 2012, following the shale gas boom and the economic decline in 2008-2009, St-Laurent said. "As such, investment risks are too high for merchant transmission projects," she said.

Northeast power market fundamentals "remain strong for long-term contracts," on transmission projects or equipment upgrades that can deliver clean power from Quebec and "help our neighbors reach their ambitious clean energy goals," St-Laurent said.


NEW ENGLAND

In March 2017 an HQ proposal was selected by Massachusetts regulators to supply 9.45 TWh of firm energy to be delivered for 20 years. HQ`s proposal consisted of hydro power supply and possible transmission scenarios developed in conjunction with US partners.

The two leading options include a route through New Hampshire called Northern Pass and New England Clean Energy Connect through Maine.

The New Hampshire Site Evaluation Committee in March 2018 voted unanimously to deny approval of the $1.6 billion Northern Pass Transmission project, which is a joint venture between HQ and Eversource Energy`s transmission business. Eversource has been fighting the decision, with the New Hampshire Supreme Court accepting the company`s appeal of the NHSEC decision in October.

Briefs are being filed and oral arguments are likely to begin late spring or early summer, spokesman William Hinkle said in an email Tuesday.

After the Northern Pass permitting delay, Massachusetts chose the New England Clean Energy Connect project, which is a projected 1,200 MW transmission line, with 1,090 MW contracted to Massachusetts, leaving 110 MW for use on a merchant basis, according to St-Laurent.

NECEC is a joint venture between HQ and Central Maine Power, which is a subsidiary of Avangrid, a company affiliated with Spain`s Iberdrola. The NECEC project has received opposition from some environmental groups and still needs several state and federal permits.


NEW YORK

"The 5% of New York`s load that we furnish year in and year out ... is mostly going into the north of the state, it`s not coming down here," Sutherland said during a discussion at Pace University in New York City in 2017.

One potential project moving through the permitting phase, is the $2.2 billion, 1,000-MW Champlain Hudson Power Express transmission line being pursued by Transmission Developers -- a Blackstone portfolio company -- that would transport power from Quebec to Queens, New York.

Under New York`s proposed Climate Leadership Act which calls for the 100% carbon-free energy goal, renewable generation eligibility would be determined by the Public Service Commission. The PSC did not respond to a question about whether hydro power from Quebec is being considered as a potential option for meeting the state`s clean energy goal.


Related News

View more

Sign Up for Electricity Forum’s Newsletter

Stay informed with our FREE Newsletter — get the latest news, breakthrough technologies, and expert insights, delivered straight to your inbox.

Electricity Today T&D Magazine Subscribe for FREE

Stay informed with the latest T&D policies and technologies.
  • Timely insights from industry experts
  • Practical solutions T&D engineers
  • Free access to every issue

Download the 2025 Electrical Training Catalog

Explore 50+ live, expert-led electrical training courses –

  • Interactive
  • Flexible
  • CEU-cerified