The NYISO is working with neighboring grid operators to implement similar pricing and scheduling changes as part of a Broader Regional Markets initiative. Potomac Economics estimates annual production cost savings of $175 million for New York when EITC is fully implemented with all neighboring control areas. Estimated annual production cost savings associated with New York rise to $193 million and $360 million throughout the region when the full array of Broader Regional Markets measures — including coordinated transmission congestion management — become effective.
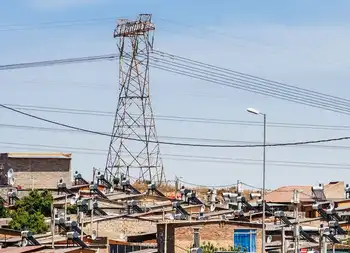
Eskom Wind Power Curtailment reflects South Africa's lockdown-driven drop in electricity demand, prompting grid-balancing measures as Eskom signals reduced IPP procurement from renewable energy projects during low-demand hours, despite guarantees and flexible generation constraints.
Key Points
A temporary reduction of wind IPP purchases by Eskom to balance surplus grid capacity during the COVID-19 lockdown slump
✅ Demand drop of 7,500 MW reduced need for variable renewables.
✅ Curtailment likely during low-demand early-morning hours.
✅ IPP revenues protected via contract extensions and guarantees.
South African state utility Eskom has told independent wind farms that it could buy less of their power in the coming days, as electricity demand has plummeted during a lockdown, reflecting the Covid-19 impact on renewables worldwide, aimed at curbing the spread of the coronavirus.
Eskom, which is mired in a financial crisis and has struggled to keep the lights on in the past year, said on Tuesday that power demand had dropped by more than 7,500 megawatts since the lockdown started on Friday and that it had taken offline some of its own generators.
The utility supplements its generating capacity, which is mainly derived from coal, by buying power from solar and wind farms, as wind becomes a competitive source of electricity globally, under contracts signed as part of the government’s renewable energy programme.
Spokesman Sikonathi Mantshantsha said Eskom had not yet curtailed power procurement from wind farms but that it had told them, echoing industry warnings on wind investment risk seen by the sector, this could happen “for a few hours a day during the next few days, perhaps until the lockdown is lifted”.
“Most of them are able to feed power into the grid in the early hours of the day. That coincides with the lowest demand period and can highlight curtailment challenges when supply exceeds need. And we now have a lot more capacity than needed,” Mantshantsha said.
During the lockdown imposed by President Cyril Ramaphosa, businesses apart from those deemed “essential services” are closed, mirroring Spanish wind factory closures elsewhere. Many power-hungry mines and furnaces have suspended operations.
Eskom has relatively little of its own “flexible generation” capacity, which can be ramped up or down easily, unlike regions riding a renewables boom in South Australia to export power.
The government has committed to buy up to 200 billion rand ($11.1 billion) of electricity from independent power producers and has issued state guarantees for those purchases.
“They will be compensated for their losses, amid U.S. utility-solar slowdowns being reported - each day lost will be added to their contracts,” Mantshantsha said of the wind farms. “In the end they will not be worse off.”
Nighttime Thermoelectric Generator converts radiative cooling into renewable energy, leveraging outer space cold; a Stanford-UCLA prototype complements solar, serving off-grid loads with low-power output during peak evening demand, using simple materials on a rooftop.
Key Points
A device converting nighttime radiative cooling into electricity, complementing solar for low-power evening needs.
✅ Uses thermocouples to convert temperature gradients to voltage.
✅ Exploits radiative cooling to outer space for night power.
✅ Complements solar; low-cost parts suit off-grid applications.
Two years ago, one freezing December night on a California rooftop, a tiny light shone weakly with a little help from the freezing night air. It wasn't a very bright glow. But it was enough to demonstrate the possibility of generating renewable power after the Sun goes down.
Working with Stanford University engineers Wei Li and Shanhui Fan, University of California Los Angeles materials scientist Aaswath Raman put together a device that produces a voltage by channelling the day's residual warmth into cooling air, effectively generating electricity from thin air with passive heat exchange.
"Our work highlights the many remaining opportunities for energy by taking advantage of the cold of outer space as a renewable energy resource," says Raman.
"We think this forms the basis of a complementary technology to solar. While the power output will always be substantially lower, it can operate at hours when solar cells cannot."
For all the merits of solar energy, it's just not a 24-7 source of power, although research into nighttime solar cells suggests new possibilities for after-dark generation. Sure, we can store it in a giant battery or use it to pump water up into a reservoir for later, but until we have more economical solutions, nighttime is going to be a quiet time for renewable solar power.
Most of us return home from work as the Sun is setting, and that's when energy demands spike to meet our needs for heating, cooking, entertaining, and lighting.
Unfortunately, we often turn to fossil fuels to make up the shortfall. For those living off the grid, it could require limiting options and going without a few luxuries.
Shanhui Fan understands the need for a night time renewable power source well. He's worked on a number of similar devices, including carbon nanotube generators that scavenge ambient energy, and a recent piece of technology that flipped photovoltaics on its head by squeezing electricity from the glow of heat radiating out of the planet's Sun-warmed surface.
While that clever item relied on the optical qualities of a warm object, this alternative device makes use of the good old thermoelectric effect, similar to thin-film waste-heat harvesting approaches now explored.
Using a material called a thermocouple, engineers can convert a change in temperature into a difference in voltage, effectively turning thermal energy into electricity with a measurable voltage. This demands something relatively toasty on one side and a place for that heat energy to escape to on the other.
The theory is the easy part – the real challenge is in arranging the right thermoelectric materials in such a way that they'll generate a voltage from our cooling surrounds that makes it worthwhile.
To keep costs down, the team used simple, off-the-shelf items that pretty much any of us could easily get our hands on.
They put together a cheap thermoelectric generator and linked it with a black aluminium disk to shed heat in the night air as it faced the sky. The generator was placed inside a polystyrene enclosure sealed with a window transparent to infrared light, and linked to a single tiny LED.
For six hours one evening, the box was left to cool on a roof-top in Stanford as the temperature fell just below freezing. As the heat flowed from the ground into the sky, the small generator produced just enough current to make the light flicker to life.
At its best, the device generated around 0.8 milliwatts of power, corresponding to 25 milliwatts of power per square metre.
That might just be enough to keep a hearing aid working. String several together and you might just be able to keep your cat amused with a simple laser pointer. So we're not talking massive amounts of power.
But as far as prototypes go, it's a fantastic starting point. The team suggests that with the right tweaks and the right conditions, 500 milliwatts per square metre isn't out of the question.
"Beyond lighting, we believe this could be a broadly enabling approach to power generation suitable for remote locations, and anywhere where power generation at night is needed," says Raman.
While we search for big, bright ideas to drive the revolution for renewables, it's important to make sure we don't let the smaller, simpler solutions like these slip away quietly into the night.
Alberta Electricity Rebate Extension provides $50 monthly credits, utility bill relief, and an natural gas rebate, supporting homes, farms, and small businesses with energy costs through December 2022, capped at 250 MWh per year.
Key Points
A provincial program extending $50 credits and energy relief, with a natural gas rebate for eligible consumers in 2022.
✅ Up to $300 in bill credits; auto-applied to eligible accounts
✅ Applies to whole bill; limit 250 MWh/year consumption
✅ Natural gas rebate triggers above $6.50/GJ Oct-Mar 2023
Alberta's electricity rebate program has been extended by three months amid an electricity price spike in Alberta, and will now be in effect until the end of December, the government said.
The program was originally to provide more than 1.9 million homes, farms and small businesses with $50 monthly credits on their electricity bills, complementing a consumer price cap on power bills, for July, August and September. It will now also cover the final three months of 2022.
Those eligible for the rebate could receive up to $300 in credits until the end of December, a relief for Alberta ratepayers facing deferral costs.
The program, designed to provide relief to Albertans hit hard by high utility bills and soaring energy prices, will cost the Alberta government $600 million.
Albertans who have consumed electricity within the past calendar year, up to a maximum of 250 megawatt hours per year, are eligible for the rebates, which will be automatically applied to consumer bills, as seen in Ontario electricity bill support initiatives.
The rebates will apply to the entire bill, similar to a lump-sum credit in Newfoundland and Labrador, not just the energy portion, the government said. The rebates will be automatic and no application will be needed.
Starting October, the government will enact a natural gas rebate program until March 2023 that will kick in when prices exceed $6.50 per gigajoule, and Alberta's consumer price cap on electricity will remain in place.
US utilities COVID-19 resilience shows electric utilities maintaining demand stability, reaffirming earnings guidance, and accessing the bond market for low-cost financing, as Dominion, NextEra, and Con Edison manage recession risks.
Key Points
It is the sector's capacity to sustain demand, financing access, and guidance despite pandemic recession pressures.
✅ Bond market access locks in low-cost, long-term debt
Dominion Energy (D) expects "incremental residential load" gains, consistent with COVID-19 electricity demand patterns, as a result of COVID-19 fallout. Southern Company CEO Tom Fanning says his company is "nowhere near" a need to review earnings guidance because of a potential recession, in a region where efficiency and demand response can help level electricity demand for years.
Sempra Energy (SRE) has reaffirmed earnings per share guidance for 2020 and 2021, as well timing for the sale of assets in Chile and Peru, and peers such as Duke Energy's renewables plan have reaffirmed capital investments to deliver cleaner energy and economic growth. And Xcel Energy (XEL) says it still "hasn’t seen material impact on its business."
Several electric utilities have demonstrated ability to tap the bond market, in line with utility sector trends in recent years, to lock in low-cost financing, as America moves toward broader electrification, despite ongoing turmoil. Their ranks include Dominion Energy, renewable energy leader NextEra Energy (NEE) and Consolidated Edison (ED), which last week sold $1 billion of 30-year bonds at a coupon rate of just 3.95 percent.
It’s still early days for US COVID-19 fallout. And most electric companies have yet to issue guidance. That’s understandable, since so much is still unknown about the virus and the damage it will ultimately do to human health and the global economy. But so far, the US power industry is showing typical resilience in tough times, as it coordinates closely with federal partners to maintain reliability.
Will it last? We won’t know for certain until there’s a lot more data. NextEra is usually first to report its Q1 earnings reports and detailed guidance. But that’s not expected until April 23. And companies may delay financials further, should the virus and efforts to control it impede collection and analysis of data, and as they address electricity shut-off risks affecting customers.
PG&E Bankruptcy Plan outlines wildfire victims compensation via a $13.5B trust funded by cash and stock, aiming CPUC and court approval before June 30 to access the state wildfire insurance fund and finalize settlement.
Key Points
A regulator-approved plan funding a $13.5B wildfire victims trust with cash and PG&E stock to exit bankruptcy.
✅ $13.5B trust split between cash and PG&E shares
✅ Targets CPUC and court approval to meet June 30 deadline
✅ Accesses state wildfire insurance fund for future risks
Pacific Gas & Electric's plan for getting out of bankruptcy has won overwhelming support from the victims of deadly Northern California wildfires ignited by the utility's fraying electrical grid, while some have pursued mega-fire lawsuits through the courts as well, despite concerns that they will be shortchanged by a $13.5 billion fund that's supposed to cover their losses.
The company announced the preliminary results of the vote on Monday without providing a specific tally. Those numbers are supposed to be filed with U.S. Bankruptcy Judge Dennis Montali by Friday.
The backing of the wildfire victims keeps PG&E on track to meet a June 30 deadline to emerge from bankruptcy in time to qualify for a coverage from a California wildfire insurance fund created to help protect the utility from getting into financial trouble again.
The current bankruptcy case, which began early last year, will require PG&E to pay out about $25.5 billion to cover the devastation caused by its neglect, including a Camp Fire guilty plea that underscored liabilities in court proceedings. It's the second time in less than 20 years that PG&E has filed for bankruptcy.
The backing for PG&E's plan isn't a surprise, even though some of the roughly 80,000 wildfire victims had been trying to rally resistance to what they consider to be a deeply flawed plan. The misgivings mostly center on the massive debt that the utility will take on to finance the plan and uncertainties about the fluctuating value of the $6.75 billion in company stock that comprises half of the $13.5 billion promised them.
As it became apparent that the COVID-19 pandemic would drive the economy into a deep recession, PG&E's shares plunged along with the rest of the stock market during March, even as it announced pandemic response measures for customers and employees during that period. That led one financial expert to estimate the PG&E stock earmarked for the wildfire victims' trust would be worth only $4.85 billion, a nearly 30% markdown.
But PG&E's stock price has rebounded in recent weeks and it's now worth more than it was when the deal setting up the victims' trust was struck last December. The shares surged more than 8% to $12.28 in Monday's late afternoon trading. The stock stood at $9.65 when PG&E reached its settlement the wildfire victims.
Critics of the utility's plan also are upset because the company still hasn't specified when the fire victims will be able to sell the shares. It now seems likely the victims will have to hold the stock through the upcoming wildfire season in Northern California, raising the specter that another calamity caused by the utility's badly outdated equipment, as power line fire reports have underscored, could cause the shares to plummet before they can cash out.
A petition signed by more than 3,100 wildfire victims recently urged Gov. Gavin Newsom to consider pushing back the deadline for qualifying for the state's wildfire from June 30 to late August to allow for more time to revise PG&E's plan, as many also turn to a wildfire assistance program for interim aid while they wait. Newsom's office hasn't responded to inquiry about the plan from The Associated Press.
But the lawyers representing the wildfire victims advised their clients to vote in favor of PG&E's plan, contending that it's the best deal they are going to get.
PG&E still must get its plan approved by the judge supervising its case, and a recent judge order on dividend use underscores the focus on wildfire mitigation. The confirmation hearings are scheduled to begin May 27. The judge, though, has indicated he will give great weight to the wishes of the wildfire victims.
California state regulators also must approve PG&E's plan, amid projections that rates will stabilize in 2025 for customers. A vote on that is scheduled Thursday before the Public Utilities Commission.
Canadian Energy Infrastructure Tariffs are reshaping pipelines, deregulation, and energy independence, as U.S. trade tensions accelerate approvals for Alberta oil sands, Trans Mountain expansion, and CAPP proposals amid regulatory reform and market diversification.
Key Points
U.S. tariff threats drive approvals, infrastructure, and diversification to strengthen Canada energy security.
✅ Tariff risk boosts support for pipelines and export routes
✅ Faster project approvals and deregulation gain political backing
✅ Diversifying markets reduces reliance on U.S. buyers
In recent months, the Canadian energy sector has experienced a shift in public and political attitudes toward infrastructure projects, particularly those related to oil and gas production. This shift has been largely influenced by the threat of tariffs from the United States, as well as growing concerns about energy independence and U.S.-Canada trade tensions more broadly.
Scott Burrows, the CEO of Pembina Pipeline Corp., noted in a conference call that the potential for U.S. tariffs on Canadian energy imports has spurred a renewed sense of urgency and receptiveness toward energy infrastructure projects in Canada. With U.S. President Donald Trump’s proposed tariffs Trump tariff threat on Canadian imports, particularly a 10% tariff on energy products, there is increasing recognition within Canada that these projects are essential for the country’s long-term economic and energy security.
While the direct impact of the tariffs is not immediate, industry leaders are optimistic about the long-term benefits of deregulation and faster project approvals, even as some see Biden as better for Canada’s energy sector overall. Burrows highlighted that while it will take time for the full effects to materialize, there are significant "tailwinds" in favor of faster energy infrastructure development. This includes the possibility of more streamlined regulatory processes and a shift toward more efficient project timelines, which could significantly benefit the Canadian energy sector.
This changing landscape is particularly important for Alberta’s oil production, which is one of the largest contributors to Canada’s energy output. The Canadian Association of Petroleum Producers (CAPP) has responded to the growing tariff threat by releasing an “energy platform,” outlining recommendations for Ottawa to help mitigate the risks posed by the evolving trade situation. The platform includes calls for improved infrastructure, such as pipelines and transportation systems, and priorities like clean grids and batteries, to ensure that Canadian energy can reach global markets more effectively.
The tariff threat has also sparked a wider conversation about the need for Canada to strengthen its energy infrastructure and reduce its dependency on the U.S. for energy exports. With the potential for escalating trade tensions, there is a growing push for Canadian energy resources to be processed and utilized more domestically, though cutting Quebec’s energy exports during a tariff war. This has led to increased political support for projects like the Trans Mountain pipeline expansion, which aims to connect Alberta’s oil sands to new markets in Asia via the west coast.
However, the energy sector’s push for deregulation and quicker approvals has raised concerns among environmental groups and Indigenous communities. Critics argue that fast-tracking energy projects could lead to inadequate environmental assessments and greater risks to local ecosystems. These concerns underscore the tension between economic development and environmental protection in the energy sector.
Despite these concerns, there is a clear consensus that Canada’s energy industry needs to evolve to meet the challenges posed by shifting trade dynamics, even as polls show support for energy and mineral tariffs in the current dispute. The proposed U.S. tariffs have made it increasingly clear that the country’s energy infrastructure needs significant investment and modernization to ensure that Canada can maintain its status as a reliable and competitive energy supplier on the global stage.
As the deadline for the tariff decision approaches, and as Ford threatens to cut U.S. electricity exports, Canada’s energy sector is bracing for the potential fallout, while also preparing to capitalize on any opportunities that may arise from the changing trade environment. The next few months will be critical in determining how Canadian policymakers, businesses, and environmental groups navigate the complex intersection of energy, trade, and regulatory reform.
While the threat of U.S. tariffs may be unsettling, it is also serving as a catalyst for much-needed changes in Canada’s energy policy. The push for faster approvals and deregulation may help address some of the immediate concerns facing the sector, but it will be crucial for the government to balance economic interests with environmental and social considerations as the country moves forward in its energy transition.