Utility Battery Storage Rankings measure grid-connected capacity, not ownership, highlighting MW, MWh, and watts per customer across PJM, MISO, and California IOUs, featuring Duke Energy, IPL, ancillary services, and frequency regulation benefits.
Key Points
Rankings that track energy storage connected to utility grids, comparing MW, MWh, and W/customer rather than ownership.
✅ Ranks by MW, MWh, and watts per customer, not asset ownership
✅ Highlights PJM, MISO cases and California IOUs' deployments
✅ Examples: Duke Energy, IPL, IID; ancillary services, frequency response
The rankings do not tally how much energy storage a utility built or owns, but how much was connected to their system. So while IPL built and owns the storage facility in its territory, Duke does not own the 16 MW of storage that connected to its system in 2016. Similarly, while California’s utilities are permitted to own some energy storage assets, they do not necessarily own all the storage facilities connected to their systems.
Measured by energy (MWh), IPL ranked fourth with 20 MWh, and Duke Energy Ohio ranked eighth with 6.1 MWh.
Ranked by energy storage watts per customer, IPL and Duke actually beat the California utilities, ranking fifth and sixth with 42 W/customer and 23 W/customer, respectively.
Duke ready for next step
Given Duke’s plans, including projects in Florida that are moving ahead, the utility is likely to stay high in the rankings and be more of a driving force in development. “Battery technology has matured, and we are ready to take the next step,” Duke spokesman Randy Wheeless told Utility Dive. “We can go to regulators and say this makes economic sense.”
Duke began exploring energy storage in 2012, and until now most of its energy storage efforts were focused on commercial projects in competitive markets where it was possible to earn revenues. Those included its 36 MW Notrees battery storage project developed in partnership with the Department of Energy in 2012 that provides frequency regulation for the Electric Reliability Council of Texas market and two 2 MW storage projects at its retired W.C. Beckjord plant in New Richmond, Ohio, that sells ancillary services into the PJM Interconnection market.
On the regulated side, most of Duke’s storage projects have had “an R&D slant to them,” Wheeless said, but “we are moving beyond the R&D concept in our regulated territory and are looking at storage more as a regulated asset.”
“We have done the demos, and they have proved out,” Wheeless said. Storage may not be ready for prime time everywhere, he said, but in certain locations, especially where it can it can be used to do more than one thing, it can make sense.
Wheeless said Duke would be making “a number of energy storage announcements in the next few months in our regulated states.” He could not provide details on those projects.
More flexible resources
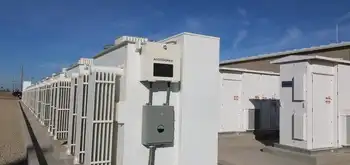
Location can be a determining factor when building a storage facility. For IPL, serving the wholesale market was a driving factor in the rationale to build its 20 MW, 20 MWh storage facility in Indianapolis.
IPL built the project to address a need for more flexible resources in light of “recent changes in our resource mix,” including decreasing coal-fired generation and increasing renewables and natural gas-fired generation, as other regions plan to rely on battery storage to meet rising demand, Joan Soller, IPL’s director of resource planning, told Utility Dive in an email. The storage facility is used to provide primary frequency response necessary for grid stability.
The Harding Street storage facility in May. It was the first energy storage project in the Midcontinent ISO. But the regulatory path in MISO is not as clear as it is in PJM, whereas initiatives such as Ontario storage framework are clarifying participation. In November, IPL with the Federal Energy Regulatory Commission, asking the regulator to find that MISO’s rules for energy storage are deficient and should be revised.
Soller said IPL has “no imminent plans to install energy storage in the future but will continue to monitor battery costs and capabilities as potential resources in future Integrated Resource Plans.”
California legislative and regulatory push
In California, energy storage did not have to wait for regulations to catch up with technology. With legislative and regulatory mandates, including CEC long-duration storage funding announced recently, as a push, California’s IOUs took high places in SEPA’s rankings.
Southern California Edison and San Diego Gas & Electric were first and fourth (63.2 MW and 17.2 MW), respectively, in terms of capacity. SoCal Ed and SDG&E were first and second (104 MWh and 28.4 MWh), respectively, and Pacific Gas and Electric was fifth (17 MWh) in terms of energy.
But a public power utility, the Imperial Irrigation District (IID), ended up high in the rankings – second in capacity (30 MW) and third in energy (20 MWh) – even though as a public power entity it is not subject to the state’s energy storage mandates.
But while IID was not under state mandate, it had a compelling regulatory reason to build the storage project. It was part of a settlement reached with FERC over a September 2011 outage, IID spokeswoman Marion Champion said.
IID agreed to a $12 million fine as part of the settlement, of which $9 million was applied to physical improvements of IID’s system.
IID ended up building a 30 MW, 20 MWh lithium-ion battery storage system at its El Centro generating station. The system went into service in October 2016 and in May, IID used the system’s 44 MW combined-cycle natural gas turbine at the generating station.
Passing savings to customers
The cost of the storage system was about $31 million, and based on its experience with the El Centro project, Champion said IID plans to add to the existing batteries. “We are continuing to see real savings and are passing those savings on to our customers,” she said.
Champion said the battery system gives IID the ability to provide ancillary services without having to run its larger generation units, such as El Centro Unit 4, at its minimum output. With gas prices at $3.59 per million British thermal units, it costs about $26,880 a day to run Unit 4, she said.
IID’s territory is in southeastern California, an area with a lot of renewable resources. IID is also not part of the California ISO and acts as its own balancing authority. The battery system gives the utility greater operational flexibility, in addition to the ability to use more of the surrounding renewable resources, Champion said.
In May, IID’s board gave the utility’s staff approval to enter into contract negotiations for a 7 MW, 4 MWh expansion of its El Centro storage facility. The negotiations are ongoing, but approval could come in the next couple months, Champion said.
The heart of the issue, though, is “the ability of the battery system to lower costs for our ratepayers,” Champion said. “Our planning section will continue to utilize the battery, and we are looking forward to its expansion,” she said.” I expect it will play an even more important role as we continue to increase our percentage of renewables.”
Related News