Columbia River Treaty Negotiations involve Canada-U.S. talks on B.C. dams, flood control, hydropower sharing, and downstream benefits, prioritizing ecosystem health, First Nations rights, and salmon restoration while balancing affordable electricity for northwest consumers.
Key Points
Talks to update flood control, hydropower, and ecosystem terms for fair benefits to B.C. and U.S. communities.
✅ Public consultations across B.C.'s Columbia Basin
✅ First Nations priorities include salmon restoration
✅ U.S. seeks cheaper power; B.C. defends downstream benefits
With talks underway between Canada and the U.S. on the future of the Columbia River Treaty, the B.C. New Democrats have launched public consultations in the region most affected by the high-stakes negotiation.
“We want to ensure Columbia basin communities are consulted, kept informed and have their voices heard,” said provincial cabinet minister Katrine Conroy via a press release announcing meetings this month in Castlegar, Golden, Revelstoke, Nakusp, Nelson and other communities.
As well as having cabinet responsibility for the talks, Conroy’s Kootenay West riding includes several places that were inundated under the terms of the 1964 flood control and power generation treaty.
“We will continue to work closely with First Nations affected by the treaty, to ensure Indigenous interests are reflected in the negotiations,” she added by way of consolation to Indigenous people who’ve been excluded from the negotiating teams on both sides of the border.
#google#
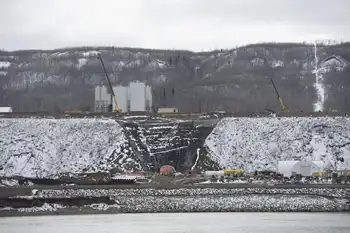
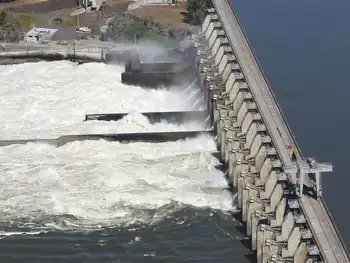
The stakes are also significant for the province as a whole. The basics of the treaty saw B.C. build dams to store water on this side of the border, easing the flood risk in the U.S. and allowing the flow to be evened out through the year. In exchange, B.C. was entitled to a share of the additional hydro power that could be generated in dams on the U.S. side.
B.C.’s sale of those downstream benefits to the U.S has poured almost $1.4 billion into provincial coffers over the past 10 years, albeit at a declining rate these days amid scrutiny from a regulator report on BC Hydro that raised concerns, because of depressed prices for cross-border electricity sales.
Politicians on the U.S. side have long sought to reopen the treaty, believing there was now a case for reducing B.C.’s entitlement.
They did not get across the threshold under President Barack Obama.
Then, last fall his successor Donald Trump served notice of intent, initiating the formal negotiations that commenced with a two day session last week in Washington, D.C. The next round is set for mid-August in B.C.
American objectives in the talks include “continued, careful management of flood risk; ensuring a reliable and economical power supply; and better addressing ecosystem concerns,” with recognition of recent BC Hydro demand declines during the pandemic.
“Economical power supply,” being a diplomatic euphemism for “cheaper electricity for consumers in the northwest states,” achievable by clawing back most of B.C.’s treaty entitlement.
On taking office last summer, the NDP inherited a 14-point statement of principles setting out B.C. hopes for negotiations to “continue the treaty” while “seeking improvements within the existing framework” of the 54-year-old agreement.
The New Democrats have endorsed those principles in a spirit of bipartisanship, even as Manitoba Hydro governance disputes play out elsewhere in Canada.
“Those principles were developed with consultation from throughout the region,” as Conroy advised the legislature this spring. “So I was involved, as well, in the process and knew what the issues were, right as they would come up.”
The New Democrats did chose to put additional emphasis on some concerns.
“There is an increase in discussion with Canada and First Nations on the return of salmon to the river,” she advised the house, recalling how construction of the enormous Grand Coulee Dam on the U.S. side in the 1930s wiped out salmon runs on the upper Columbia River.
“There was no consideration then for how incredibly important salmon was, especially to the First Nations people in our region. We have an advisory table that is made up of Indigenous representation from our region, and also we are discussing with Canada that we need to see if there’s feasibility here.”
As to feasibility, the obstacles to salmon migration in the upper reaches of the Columbia include the 168-metre high Grand Coulee and the 72-metre Chief Joseph dams on the U.S. side, plus the Keenleyside (52 metres), Revelstoke (175 metres) and Mica (240 metres) dams on the Canadian side.
Still, says Conroy “the First Nations from Canada and the tribes from the United States, have been working on scientific and technical documents and research to see if, first of all, the salmon can come up, how they can come up, and what the things are that have to be done to ensure that happens.”
The New Democrats also put more emphasis on preserving the ecosystem, aligning with clean-energy efforts with First Nations that support regional sustainability.
“I know that certainly didn’t happen in 1964, but that is something that’s very much on the minds of people in the Columbia basin,” said Conroy. “If we are going to tweak the treaty, what can we do to make sure the voices of the basin are heard and that things that were under no consideration in the ’60s are now a topic for consideration?”
With those new considerations, there’s still the status quo concern of preserving the downstream benefits as a trade off for the flooding and other impacts on this side of the border.
The B.C. position on that score is the same under the New Democrats as it was under the Liberals, despite a B.C. auditor general report on deferred BC Hydro costs.
“The level of benefits to B.C., which is currently solely in the form of the (electricity) entitlement, does not account for the full range of benefits in the U.S. or the impacts in B.C.,” says the statement of principle.
“All downstream U.S. benefits such as flood risk management, hydropower, ecosystems, water supply (including municipal, industrial and agricultural uses), recreation, navigation and other related benefits should be accounted for and such value created should be shared equitably between the two countries.”
No surprise if the Americans do not see it the same way. But that is a topic for another day.
Related News