Ontario looks at $36 billion in industrial project work

By Industrial Info Resources


NFPA 70e Training

Our customized live online or in‑person group training can be delivered to your staff at your location.

  • Live Online
  • 6 hours Instructor-led
  • Group Training Available
Regular Price:
$199
Coupon Price:
$149
Reserve Your Seat Today
In Ontario, there are 415 industrial projects totaling more than $36 billion that have either already begun construction in 2008 or are scheduled to begin construction.

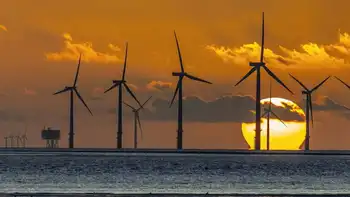
The majority of the work planned is in the Power Industry, which makes up 72% of the spending with $26 billion planned, mainly for new nuclear power units and windfarms.

Bruce Power LP and Ontario Power Generation are both planning billion-dollar nuclear unit additions in Ontario. Canadian Hydro Developers Incorporated began site preparation activities for a 198-megawatt windfarm project on Wolfe Island. This is just one of a large number of windfarm projects scheduled for the province.

The second busiest industry in Ontario is the Metals & Minerals Industry with 72 projects totaling $3.5 billion. Xstrata Canada Incorporated began a $121 million project to extend the life of its Kidd Creek copper-zinc mine.

After the Metals & Minerals Industry is the Industrial Manufacturing Industry with 60 projects totaling $3 billion. Earlier this summer, Chrysler Canada Incorporated began retooling its 3 million-square-foot automobile assembly plant in Brampton.

The $1.4 billion project is scheduled to be completed next fall.

Related News

Berlin Launches Electric Flying Ferry

Berlin Flying Electric Ferry drives sustainable urban mobility with zero-emission water transit, advanced electric propulsion, quiet operations, and smart-city integration, easing congestion, improving air quality, and connecting waterways for efficient, climate-aligned public transport.


Key Points

A zero-emission electric ferry for Berlin's waterways, cutting congestion and pollution to advance sustainable mobility.

✅ Zero emissions with advanced electric propulsion systems

✅ Quiet, efficient water transit that eases road congestion

✅ Smart-city integration, improving access and air quality


Berlin has taken a groundbreaking step toward sustainable urban mobility with the introduction of its innovative flying electric ferry. This pioneering vessel, designed to revolutionize water-based transportation, represents a significant leap forward in eco-friendly travel options and reflects the city’s commitment to addressing climate change, complementing its zero-emission bus fleet initiatives while enhancing urban mobility.

A New Era of Urban Transport

The flying electric ferry, part of a broader initiative to modernize transportation in Berlin, showcases cutting-edge technology aimed at reducing carbon emissions and improving efficiency in urban transit, and mirrors progress seen with hybrid-electric ferries in the U.S.

Equipped with advanced electric propulsion systems, the ferry operates quietly and emits zero emissions during its journeys, making it an environmentally friendly alternative to traditional diesel-powered boats.

This innovation is particularly relevant for cities like Berlin, where water transportation can play a crucial role in alleviating congestion on roads and enhancing overall mobility. The ferry is designed to navigate the city’s extensive waterways, providing residents and visitors with a unique and efficient way to traverse the urban landscape.

Features and Design

The ferry’s design emphasizes both functionality and comfort. Its sleek, aerodynamic shape minimizes resistance in the water, allowing for faster travel times while consuming less energy, similar to emerging battery-electric high-speed ferries now under development in the U.S. Additionally, the vessel is equipped with state-of-the-art navigation systems that ensure safety and precision during operations.

Passengers can expect a comfortable onboard experience, complete with spacious seating and amenities designed to enhance their journey. The ferry aims to offer an enjoyable ride while contributing to Berlin’s vision of a sustainable and interconnected transportation network.

Addressing Urban Challenges

Berlin, like many major cities worldwide, faces significant challenges related to transportation, including traffic congestion, pollution, and the need for efficient public transit options. The introduction of the flying electric ferry aligns with the city’s goals to promote greener modes of transportation and reduce reliance on fossil fuels, as seen with B.C.'s electric ferries supported by public investment.

By offering an alternative to conventional commuting methods and complementing battery-electric buses deployments in Toronto that expand zero-emission options, the ferry has the potential to significantly reduce the number of vehicles on the roads. This shift could lead to lower traffic congestion levels, improved air quality, and a more pleasant urban environment for residents and visitors alike.

Economic and Environmental Benefits

The economic implications of the flying electric ferry are equally promising. As an innovative mode of transportation, it can attract tourism and stimulate local businesses near docking areas, especially as ports adopt an all-electric berth model that reduces local emissions. Increased accessibility to various parts of the city may lead to greater foot traffic in commercial districts, benefiting retailers and service providers.

From an environmental standpoint, the ferry contributes to Berlin’s commitment to achieving climate neutrality. The city has set ambitious targets to reduce greenhouse gas emissions, and the implementation of electric vessels is a key component of this strategy. By prioritizing clean energy solutions, Berlin is positioning itself as a leader in sustainable urban transport.

A Vision for the Future

The introduction of the flying electric ferry is not merely a technological advancement; it represents a vision for the future of urban mobility. As cities around the world grapple with the impacts of climate change and the need for sustainable infrastructure, Berlin’s innovative approach could serve as a model for other urban centers looking to enhance their transportation systems, alongside advances in electric planes that could reshape regional travel.

Furthermore, this initiative is part of a broader trend toward electrification in the maritime sector. With advancements in battery technology and renewable energy sources, electric ferries and boats are becoming more viable options for urban transportation. As more cities embrace these solutions, the potential for cleaner, more efficient public transport grows.

Community Engagement and Education

To ensure the success of the flying electric ferry, community engagement and education will be vital. Residents must be informed about the benefits of using this new mode of transport, and outreach efforts can help build excitement and awareness around its launch. By fostering a sense of ownership among the community, the ferry can become an integral part of Berlin’s transportation landscape.


Related News

View more

Which of the cleaner states imports dirty electricity?

Hourly Electricity Emissions Tracking maps grid balancing areas, embodied emissions, and imports/exports, revealing carbon intensity shifts across PJM, ERCOT, and California ISO, and clarifying renewable energy versus coal impacts on health and climate.


Key Points

An hourly method tracing generation, flows, and embodied emissions to quantify carbon intensity across US balancing areas.

✅ Hourly traces of imports/exports and generation mix

✅ Consumption-based carbon intensity by balancing area

✅ Policy insights for renewables, coal, health costs


In the United States, electricity generation accounts for nearly 30% of our carbon emissions. Some states have responded to that by setting aggressive renewable energy standards; others are hoping to see coal propped up even as its economics get worse. Complicating matters further is the fact that many regional grids are integrated, and as America goes electric the stakes grow, meaning power generated in one location may be exported and used in a different state entirely.

Tracking these electricity exports is critical for understanding how to lower our national carbon emissions. In addition, power from a dirty source like coal has health and environment impacts where it's produced, and the costs of these aren't always paid by the parties using the electricity. Unfortunately, getting reliable figures on how electricity is produced and where it's used is challenging, even for consumers trying to find where their electricity comes from in the first place, leaving some of the best estimates with a time resolution of only a month.

Now, three Stanford researchers—Jacques A. de Chalendar, John Taggart, and Sally M. Benson—have greatly improved on that standard, and they have managed to track power generation and use on an hourly basis. The researchers found that, of the 66 grid balancing areas within the United States, only three have carbon emissions equivalent to our national average, and they have found that imports and exports of electricity have both seasonal and daily changes. de Chalendar et al. discovered that the net results can be substantial, with imported electricity increasing California's emissions/power by 20%.

Hour by hour
To figure out the US energy trading landscape, the researchers obtained 2016 data for grid features called balancing areas. The continental US has 66 of these, providing much better spatial resolution on the data than the larger grid subdivisions. This doesn't cover everything—several balancing areas in Canada and Mexico are tied in to the US grid—and some of these balancing areas are much larger than others. The PJM grid, serving Pennsylvania, New Jersey, and Maryland, for example, is more than twice as large as Texas' ERCOT, in a state that produces and consumes the most electricity in the US.

Despite these limitations, it's possible to get hourly figures on how much electricity was generated, what was used to produce it, and whether it was used locally or exported to another balancing area. Information on the generating sources allowed the researchers to attach an emissions figure to each unit of electricity produced. Coal, for example, produces double the emissions of natural gas, which in turn produces more than an order of magnitude more carbon dioxide than the manufacturing of solar, wind, or hydro facilities. These figures were turned into what the authors call "embodied emissions" that can be traced to where they're eventually used.

Similar figures were also generated for sulfur dioxide and nitrogen oxides. Released by the burning of fossil fuels, these can both influence the global climate and produce local health problems.

Huge variation
The results were striking. "The consumption-based carbon intensity of electricity varies by almost an order of magnitude across the different regions in the US electricity system," the authors conclude. The low is the Bonneville Power grid region, which is largely supplied by hydropower; it has typical emissions below 100kg of carbon dioxide per megawatt-hour. The highest emissions come in the Ohio Valley Electric region, where emissions clear 900kg/MW-hr. Only three regional grids match the overall grid emissions intensity, although that includes the very large PJM (where capacity auction payouts recently fell), ERCOT, and Southern Co balancing areas.

Most of the low-emissions power that's exported comes from the Pacific Northwest's abundant hydropower, while the Rocky Mountains area exports electricity with the highest associated emissions. That leads to some striking asymmetries. Local generation in the hydro-rich Idaho Power Company has embodied emissions of only 71kg/MW-hr, while its imports, coming primarily from Rocky Mountain states, have a carbon content of 625kg/MW-hr.

The reliance on hydropower also makes the asymmetry seasonal. Local generation is highest in the spring as snow melts, but imports become a larger source outside this time of year. As solar and wind can also have pronounced seasonal shifts, similar changes will likely be seen as these become larger contributors to many of these regional grids. Similar things occur daily, as both demand and solar production (and, to a lesser extent, wind) have distinct daily profiles.

The Golden State
California's CISO provides another instructive case. Imports represent less than 30% of its total electric use in 2016, yet California electricity imports provided 40% of its embodied emissions. Some of these, however, come internally from California, provided by the Los Angeles Department of Water and Power. The state itself, however, has only had limited tracking of imported emissions, lumping many of its sources as "other," and has been exporting its energy policies to Western states in ways that shape regional markets.

Overall, the 2016 inventory provides a narrow picture of the US grid, as plenty of trends are rapidly changing our country's emissions profile, including the rise of renewables and the widespread adoption of efficiency measures and other utility trends in 2017 that continue to evolve. The method developed here can, however, allow for annual updates, providing us with a much better picture of trends. That could be quite valuable to track things like how the rapid rise in solar power is altering the daily production of clean power.

More significantly, it provides a basis for more informed policymaking. States that wish to promote low-emissions power can use the information here to either alter the source of their imports or to encourage the sites where they're produced to adopt more renewable power. And those states that are exporting electricity produced primarily through fossil fuels could ensure that the locations where the power is used pay a price that includes the health costs of its production.


Related News

View more

U.S. Electric Vehicle Market Share Dips in Q1 2024

U.S. EV Market Share Dip Q1 2024 reflects slower BEV adoption, rising PHEV demand, affordability concerns, charging infrastructure gaps, tax credit shifts, range anxiety, and automaker strategy adjustments across the electric vehicle market.


Key Points

Q1 2024 EV and hybrid share slipped as BEV sales lag, PHEVs rise, and affordability and charging concerns temper demand.

✅ BEV share fell to 7.0% as affordable models remain limited

✅ PHEV sales rose 50% YoY, easing range anxiety concerns

✅ Policy shifts and charging gaps weigh on consumer adoption


The U.S. electric vehicle (EV) market, once a beacon of unbridled growth, appears to be experiencing a course correction. Data from the U.S. Energy Information Administration (EIA) reveals that the combined market share of electric vehicles (battery electric vehicles, or BEVs) and hybrids dipped slightly in the first quarter of 2024, marking the first decline since the onset of the COVID-19 pandemic, even as EU EV share rose during lockdowns in 2020.

This news comes as a surprise to many analysts who predicted continued exponential growth for the EV market. While overall sales of electric vehicles surged into 2024 and did increase by 7% compared to Q1 2023, this growth wasn't enough to keep pace with the overall rise in vehicle sales. The result: a decline in market share from 18.8% in Q4 2023 to 18.0% in Q1 2024.

Several factors may be contributing to this shift. One potential culprit is a slowdown in battery electric vehicle sales. BEVs saw their share of the market dip from 8.1% to 7.0% in the same period. This could be attributed to a lack of readily available affordable options, with many popular EV models still commanding premium prices and concerns that EV supply may miss demand in the near term.

Another factor could be the rising interest in plug-in hybrid electric vehicles (PHEVs). PHEV sales witnessed a significant jump of 50% year-over-year, reflecting how gas-electric hybrids are getting a boost from major automakers, potentially indicating a consumer preference for vehicles that offer both electric and gasoline powertrain options, addressing concerns about range anxiety often associated with BEVs.

Industry experts offer mixed interpretations of this data. Some downplay the significance of the dip, attributing it to a temporary blip, even though EVs remain behind gas cars in total sales. They point to the ongoing commitment from major automakers to invest in EV production and the potential for new, more affordable models to hit the market soon.

Others express more concern, citing Europe's recent EV slump and suggesting this might be a sign of maturing consumer preferences. They argue that simply increasing the number of EVs on the market might not be enough. Automakers need to address issues like affordability, charging infrastructure, and range anxiety to maintain momentum.

The role of government incentives also remains a question mark. The federal tax credit for electric vehicles is currently set to phase out gradually, potentially impacting consumer purchasing decisions in the future. Continued government support, through incentives or infrastructure development, could be crucial in maintaining consumer interest.

The coming quarters will be crucial in determining the long-term trajectory of the U.S. EV market, especially after the global electric car market's rapid expansion in recent years. Whether this is a temporary setback or a more lasting trend remains to be seen. Addressing consumer concerns, ensuring a diverse range of affordable EV options, and continued government support will all be essential in ensuring the continued growth of this critical sector.

This development also presents an opportunity for traditional automakers. By capitalizing on the growing PHEV market and addressing consumer concerns about affordability and range anxiety, they can carve out a strong position in the evolving automotive landscape.


Related News

View more

British Columbia Halts Further Expansion of Self-Driving Vehicles

BC Autonomous Vehicle Ban freezes new driverless testing and deployment as BC develops a regulatory framework, prioritizing safety, liability clarity, and road sharing with pedestrians and cyclists while existing pilot projects continue.


Key Points

A moratorium pausing new driverless testing until a safety-first regulatory framework and clear liability rules exist.

✅ Freezes new AV testing and deployment provincewide

✅ Current pilot shuttles continue under existing approvals

✅ Focus on safety, liability, and road-user integration


British Columbia has halted the expansion of fully autonomous vehicles on its roads. The province has announced it will not approve any new applications for testing or deployment of vehicles that operate without a human driver until it develops a new regulatory framework, even as it expands EV charging across the province.


Safety Concerns and Public Questions

The decision follows concerns about the safety of self-driving vehicles and questions about who would be liable in the event of an accident. The BC government emphasizes the need for robust regulations to ensure that self-driving cars and trucks can safely share the road with traditional vehicles, pedestrians, and cyclists, and to plan for infrastructure and power supply challenges associated with electrified fleets.

"We want to make sure that British Columbians are safe on our roads, and that means putting the proper safety guidelines in place," said Rob Fleming, Minister of Transportation and Infrastructure. "As technology evolves, we're committed to developing a comprehensive framework to address the issues surrounding self-driving technology."


What Does the Ban Mean?

The ban does not affect current pilot projects involving self-driving vehicles that already operate in BC, such as limited shuttle services and segments of the province's Electric Highway that support charging and operations.


Industry Reaction

The response from industry players working on autonomous vehicle technology has been mixed, amid warnings of a potential EV demand bottleneck as adoption ramps up. While some acknowledge the need for clear regulations, others express concern that the ban could stifle innovation in the province.

"We understand the government's desire to ensure safety, but a blanket ban risks putting British Columbia behind in the development of this important technology," says a spokesperson for a self-driving vehicle start-up.


Debate Over Self-Driving Technology

The BC ban highlights a larger debate about the future of autonomous vehicles. While proponents point to potential benefits such as improved safety, reduced traffic congestion, and increased accessibility, and national policies like Canada's EV goals aim to accelerate adoption, critics raise concerns about liability, potential job losses in the transportation sector, and the ability of self-driving technology to handle complex driving situations.


BC Not Alone

British Columbia is not the only jurisdiction grappling with the regulation of self-driving vehicles. Several other provinces and states in both Canada and the U.S. are also working to develop clear legal and regulatory frameworks for this rapidly evolving technology, even as studies suggest B.C. may need to double its power output to fully electrify road transport.


The Road Ahead

The path forward for fully autonomous vehicles in BC depends on the government's ability to create a regulatory framework that balances safety considerations with fostering innovation, and align with clean-fuel investments like the province's hydrogen project to support zero-emission mobility.  When and how that framework will materialize remains unclear, leaving the future of self-driving cars in the province temporarily uncertain.


Related News

View more

On the road to 100 per cent renewables

US Climate Alliance 100% Renewables 2035 accelerates clean energy, electrification, and decarbonization, replacing coal and gas with wind, solar, and storage to cut air pollution, lower energy bills, create jobs, and advance environmental justice.


Key Points

A state-level target for alliance members to meet all electricity demand with renewable energy by 2035.

✅ 100% RES can meet rising demand from electrification

✅ Major health gains from reduced SO2, NOx, and particulates

✅ Jobs grow, energy burdens fall, climate resilience improves


The Union of Concerned Scientists joined with COPAL (Minnesota), GreenRoots (Massachusetts), and the Michigan Environmental Justice Coalition, to better understand the feasibility and implications of leadership states meeting 100 percent of their electricity needs with renewable energy by 2035, a target reflected in federal clean electricity goals under discussion today.

We focused on 24 member states of the United States Climate Alliance, a bipartisan coalition of governors committed to the goals of the 2015 Paris Climate Agreement. We analyzed two main scenarios: business as usual versus 100 percent renewable electricity standards, in line with many state clean energy targets now in place.

Our analysis shows that:

Climate Alliance states can meet 100 percent of their electricity consumption with renewable energy by 2035, as independent assessments of zero-emissions feasibility suggest. This holds true even with strong increases in demand due to the electrification of transportation and heating.

A transition to renewables yields strong benefits in terms of health, climate, economies, and energy affordability.

To ensure an equitable transition, states should broaden access to clean energy technologies and decision making to include environmental justice and fossil fuel-dependent communitieswhile directly phasing out coal and gas plants.

Demands for climate action surround us. Every day brings news of devastating "this is not normal" extreme weather: record-breaking heat waves, precipitation, flooding, wildfires. To build resilience and mitigate the worst impacts of the climate crisis requires immediate action to reduce heat-trapping emissions and transition to renewable energy, including practical decarbonization strategies adopted by states.

On the Road to 100 Percent Renewables explores actions at one critical level: how leadership states can address climate change by reducing heat-trapping emissions in key sectors of the economy as well as by considering the impacts of our energy choices. A collaboration of the Union of Concerned Scientists and local environmental justice groups COPAL (Minnesota), GreenRoots (Massachusetts), and the Michigan Environmental Justice Coalition, with contributions from the national Initiative for Energy Justice, assessed the potential to accelerate the use of renewable energy dramatically through state-level renewable electricity standards (RESs), major drivers of clean energy in recent decades. In addition, the partners worked with Greenlink Analytics, an energy research organization, to assess how RESs most directly affect people's lives, such as changes in public health, jobs, and energy bills for households.

Focusing on 24 members of the United States Climate Alliance (USCA), the study assesses the implications of meeting 100 percent of electricity consumption in these states, including examples like Rhode Island's 100% by 2030 plan that inform policy design, with renewable energy in the near term. The alliance is a bipartisan coalition of governors committed to reducing heat-trapping emissions consistent with the goals of the 2015 Paris climate agreement.[1]

On the Road to 100 Percent Renewables looks at three types of results from a transition to 100 percent RES policies: improvements in public health from decreasing the use of coal and gas2 power plants; net job creation from switching to more labor-oriented clean energy; and reduced household energy bills from using cleaner sources of energy. The study assumes a strong push to electrify transportation and heating to address harmful emissions from the current use of fossil fuels in these sectors. Our core policy scenario does not focus on electricity generation itself, nor does it mandate retiring coal, gas, and nuclear power plants or assess new policies to drive renewable energy in non-USCA states.

Our analysis shows that:

USCA states can meet 100 percent of their electricity consumption with renewable energy by 2035 even with strong increases in demand due to electrifying transportation and heating.

A transition to renewables yields strong benefits in terms of health, climate, economies, and energy affordability.

Renewable electricity standards must be paired with policies that address not only electricity consumption but also electricity generation, including modern grid infrastructure upgrades that enable higher renewable shares, both to transition away from fossil fuels more quickly and to ensure an equitable transition in which all communities experience the benefits of a clean energy economy.

Currently, the states in this analysis meet their electricity needs with differing mixes of electricity sourcesfossil fuels, nuclear, and renewables. Yet across the states, the study shows significant declines in fossil fuel use from transitioning to clean electricity; the use of solar and wind powerthe dominant renewablesgrows substantially:

In the study's "No New Policy" scenario"business as usual"coal and gas generation stay largely at current levels over the next two decades. Electricity generation from wind and solar grows due to both current policies and lowest costs.

In a "100% RES" scenario, each USCA state puts in place a 100 percent renewable electricity standard. Gas generation falls, although some continues for export to non-USCA states. Coal generation essentially disappears by 2040. Wind and solar generation combined grow to seven times current levels, and three times as much as in the No New Policy scenario.

A focus on meeting in-state electricity consumption in the 100% RES scenario yields important outcomes. Reductions in electricity from coal and gas plants in the USCA states reduce power plant pollution, including emissions of sulfur dioxide and nitrogen oxides. By 2040, this leads to 6,000 to 13,000 fewer premature deaths than in the No New Policy scenario, as well as 140,000 fewer cases of asthma exacerbation and 700,000 fewer lost workdays. The value of the additional public health benefits in the USCA states totals almost $280 billion over the two decades. In a more detailed analysis of three USCA statesMassachusetts, Michigan, and Minnesotathe 100% RES scenario leads to almost 200,000 more added jobs in building and installing new electric generation capacity than the No New Policy scenario.

The 100% RES scenario also reduces average energy burdens, the portion of household income spent on energy. Even considering household costs solely for electricity and gas, energy burdens in the 100% RES scenario are at or below those in the No New Policy scenario in each USCA state in most or all years. The average energy burden across those states declines from 3.7 percent of income in 2020 to 3.0 percent in 2040 in the 100% RES scenario, compared with 3.3 percent in 2040 in the No New Policy scenario.

Decreasing the use of fossil fuels through increasing the use of renewables and accelerating electrification reduces emissions of carbon dioxide (CO2), with implications for climate, public health, and economies. Annual CO2 emissions from power plants in USCA states decrease 58 percent from 2020 to 2040 in the 100% RES scenario compared with 12 percent in the No New Policy scenario.

The study also reveals gaps to be filled beyond eliminating fossil fuel pollution from communities, such as the persistence of gas generation to sell power to neighboring states, reflecting barriers to a fully renewable grid that policy must address. Further, it stresses the importance of policies targeting just and equitable outcomes in the move to renewable energy.

Moving away from fossil fuels in communities most affected by harmful air pollution should be a top priority in comprehensive energy policies. Many communities continue to bear far too large a share of the negative impacts from decades of siting the infrastructure for the nation's fossil fuel power sector in or near marginalized neighborhoods. This pattern will likely persist if the issue is not acknowledged and addressed. State policies should mandate a priority on reducing emissions in communities overburdened by pollution and avoiding investments inconsistent with the need to remove heat-trapping emissions and air pollution at an accelerated rate. And communities must be centrally involved in decisionmaking around any policies and rules that affect them directly, including proposals to change electricity generation, both to retire fossil fuel plants and to build the renewable energy infrastructure.

Key recommendations in On the Road to 100 Percent Renewables address moving away from fossil fuels, increasing investment in renewable energy, and reducing CO2 emissions. They aim to ensure that communities most affected by a history of environmental racism and pollution share in the benefits of the transition: cleaner air, equitable access to good-paying jobs and entrepreneurship alternatives, affordable energy, and the resilience that renewable energy, electrification, energy efficiency, and energy storage can provide. While many communities can benefit from the transition, strong justice and equity policies will avoid perpetuating inequities in the electricity system. State support to historically underserved communities for investing in solar, energy efficiency, energy storage, and electrification will encourage local investment, community wealth-building, and the resilience benefits the transition to renewable energy can provide.

A national clean electricity standard and strong pollution standards should complement state action to drive swift decarbonization and pollution reduction across the United States. Even so, states are well positioned to simultaneously address climate change and decades of inequities in the power system. While it does not substitute for much-needed national and international leadership, strong state action is crucial to achieving an equitable clean energy future.


Related News

View more

Power firms win UK subsidies for new Channel cables project

UK Electricity Interconnectors secure capacity market subsidies, supporting winter reliability with seabed cables to France and Belgium via the Channel Tunnel, lowering consumer costs, squeezing coal, and challenging new gas plants through cross-border energy trading.


Key Points

High-voltage cables linking Britain to Europe, securing backup capacity, cutting costs and boosting winter reliability.

✅ Won capacity market contracts at record-low prices

✅ Cables to France and Belgium via Channel Tunnel, seabed routes

✅ Squeezes coal, challenges new gas; renewables may join market


New electricity cables across the Channel to France and Belgium will be a key part of keeping Britain’s lights on during winter amid record electricity prices across Europe in the early 2020s, after their owners won backup power subsidies in a government auction this week.

For the first time, interconnector operators successfully bid for a slice of hundreds of millions’ worth of contracts in the capacity market. That will help cut costs for consumers, given how electricity is priced in Europe today, and squeeze out old coal power plants.

Three new interconnectors are currently being built to Europe, almost doubling existing capacity, with one along the Channel Tunnel and two on the seabed: one between Kent and Zeebrugge and one from Hampshire to Normandy. 

The interconnectors were success stories in this week’s capacity auction, which saw power firms bid to provide backup electricity in the winter of 2021/22. Prices for the four-year contracts hit a record low of £8.40 per kilowatt per year, which analysts described as a shock and well below expectations.

One industry source said the figure was “miles away” from what is needed to encourage companies to build big new gas power stations, which some argue are necessary to fill the gap when the UK’s ageing nuclear reactors close as Europe loses nuclear power across the region over the next decade.

While bad news for those firms, the low price is good for consumers. The subsidies will add about £525m to energy bills, or £5.68 for the average household, compared with £11 for the year before, according to analysts Cornwall Insight.

Existing gas power stations scooped up most of the contracts, but new gas ones lost out, as did several coal plants. Battery storage plants, a standout success in the last auction, fared comparatively poorly after changes to the rules.

Experts at Bernstein bank said the the misses by coal meant that around half the UK’s remaining coal power capacity could close from October 2019, when existing capacity market contracts run out. Chaitanya Kumar, policy adviser at thinktank Green Alliance, said: “Coal’s exit from the UK’s energy system just moved a step closer as coal contracts fell by half compared with last year.”

Tom Edwards, an analyst at Cornwall Insight, said that more interconnectors were likely to bid into future rounds of the capacity market, such as the cable being laid between Norway and the UK. Relying on foreign power supplies was fine, he said, provided Brexit did not make energy trading more difficult and the interconnectors delivered at times of need, where events like Irish grid price spikes illustrate the stress points.

However, one industry source, who wants to see new gas plants built in the UK, said the results showed that the system was not working, amid UK peak power prices that have climbed in recent trading. “That self-sufficiency doesn’t seem to be a priority at a time when we’re breaking away from Europe is a bit weird,” they said.

But the prospects for new gas plants in future rounds of the capacity market look bleak. They will very likely face a new source of competition next year, if energy regulator Ofgem approves a proposal to allow renewables to compete too.


Related News

View more

Sign Up for Electricity Forum’s Newsletter

Stay informed with our FREE Newsletter — get the latest news, breakthrough technologies, and expert insights, delivered straight to your inbox.

Electricity Today T&D Magazine Subscribe for FREE

Stay informed with the latest T&D policies and technologies.
  • Timely insights from industry experts
  • Practical solutions T&D engineers
  • Free access to every issue

Download the 2025 Electrical Training Catalog

Explore 50+ live, expert-led electrical training courses –

  • Interactive
  • Flexible
  • CEU-cerified