Pennsylvania Electric Rate Increases hit Peco, PPL, and Pike County, driven by natural gas costs and wholesale power markets; default rate changes, price to compare shifts, and time-of-use plans affect residential bills.
Key Points
Electric default rates are rising across Pennsylvania as natural gas costs climb, affecting Peco, PPL, and Pike customers.
✅ PPL, Peco, and Pike raising default rates Dec. 1
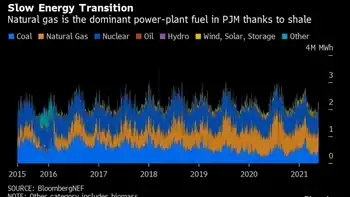
✅ Natural gas costs driving wholesale power prices
✅ Consider standard offer, TOU rates, and efficiency
Energy costs for electric customers are going up by as much as 50% across Pennsylvania next week, the latest manifestation of US electricity price increases impacting gasoline, heating oil, propane, and natural gas.
Eight Pennsylvania electric utilities are set to increase their energy prices on Dec. 1, reflecting the higher cost to produce electricity. Peco Energy, which serves Philadelphia and its suburbs, will boost its energy charge by 6.4% on Dec. 1, from 6.6 cents per kilowatt hour to about 7 cents per kWh. Energy charges account for about half of a residential bill.
PPL Electric Utilities, the Allentown company that serves a large swath of Pennsylvania including parts of Bucks, Montgomery, and Chester Counties, will impose a 26% increase on residential energy costs on Dec. 1, from about 7.5 cents per kWh to 9.5 cents per kWh. That’s an increase of $40 a month for an electric heating customer who uses 2,000 kWh a month.
Pike County Light & Power, which serves about 4,800 customers in Northeast Pennsylvania, will increase energy charges by 50%, according to the Pennsylvania Public Utility Commission.
“All electric distribution companies face the same market forces as PPL Electric Utilities,” PPL said in a statement. Each Pennsylvania utility follows a different PUC-regulated plan for procuring energy from power generators, and those forces can include rising nuclear power costs in some regions, which explains why some customers are absorbing the hit sooner rather than later, it said.
There are ways customers can mitigate the impact. Utilities offer a host of programs and grants to support low-income customers, and some states are exploring income-based fixed charges to address affordability, and they encourage anyone struggling to pay their bills to call the utility for help. Customers can also control their costs by conserving energy. It may be time to put on a sweater and weatherize the house.
Peco recently introduced time-of-use rates — as seen when Ontario ended fixed pricing — that include steep discounts for customers who can shift electric usage to late night hours — that’s you, electric vehicle owners.
There’s also a clever opportunity available for many Pennsylvania customers called the “standard offer” that might save you some real money, but you need to act before the new charges take effect on Dec. 1 to lock in the best rates.
Why are the price hikes happening?
But first, how did we get here?
Energy charges are rising for a simple reason: Fuel prices for power generators are increasing, and that’s driven mostly by natural gas. It’s pushing up electricity prices in wholesale power markets and has lifted typical residential bills in recent years.
“It’s all market forces right now,” said Nils Hagen-Frederiksen, PUC spokesperson. Energy charges are strictly a pass-through cost for utilities. Utilities aren’t allowed to mark them up.
The increase in utility energy charges does not affect customers who buy their energy from competitive power suppliers in deregulated electricity markets. About 27% of Pennsylvania’s 5.9 million electric customers who shop for electricity from third-party suppliers either pay fixed rates, whose price remains stable, or are on a variable-rate plan tied to market prices. The variable-rate electric bills have probably already increased to reflect the higher cost of generating power.
Most New Jersey electric customers are shielded for now from rising energy costs. New Jersey sets annual energy prices for customers who don’t shop for power. Those rates go into effect on June 1 and stay in place for 12 months. The current energy market fluctuations will be reflected in new rates that take effect next summer, said Lauren Ugorji, a spokesperson for Public Service Electric & Gas Co., New Jersey’s largest utility.
For each utility, its own plan
Pennsylvania has a different system for setting utility energy charges, which are also known as the “default rate,” because that’s the price a customer gets by default if they don’t shop for power. The default rate is also the same thing as the “price to compare,” a term the PUC has adopted so consumers can make an apples-to-apples comparison between a utility’s energy charge and the price offered by a competitive supplier.
Each of the state’s 11 PUC-regulated electric utilities prepares its own “default service plan,” that governs the method by which they procure power on wholesale markets. Electric distribution companies like Peco are required to buy the lowest priced power. They typically buy power in blind auctions conducted by independent agents, so that there’s no favoritism for affiliated power generators
Some utilities adjust charges quarterly, and others do it semi-annually. “This means that each [utility’s] resulting price to compare will vary as the market changes, some taking longer to reflect price changes, both up and down,” PPL said in a statement. PPL conducted its semi-annual auction in October, when energy prices were rising sharply.
Most utilities buy power from suppliers under contracts of varying durations, both long-term and short-term. The contracts are staggered so market price fluctuations are smoothed out. One utility, Pike County Power & Light, buys all its power on the spot market, which explains why its energy charge will surge by 50% on Dec. 1. Pike County’s energy charge will also be quicker to decline when wholesale prices subside, as they are expected to next year.
Peco adjusts its energy charge quarterly, but it conducts power auctions semi-annually. It buys about 40% of its power in one-year contracts, and 60% in two-year contracts, and does not buy any power on spot markets, said Richard G. Webster Jr., Peco’s vice president of regulatory policy and strategy.
“At any given time, we’re replacing about a third of our supplied portfolio,” he said.
The utility’s energy charge affects only part of the monthly bill. For a Peco residential electric customer who uses 700 kWh per month, the Dec. 1 energy charge increase will boost monthly bills by $2.94 per month, or 2.9%. For an electric heating customer who uses about 2,000 kWh per month, the change will boost bills $8.40 a month, or about 3.5%, said Greg Smore, a Peco spokesperson.
Related News