UK Net Zero Policy Delay shifts EV sales ban to 2035, eases boiler phase-outs, keeps ZEV mandate, backs North Sea oil and gas, accelerates onshore wind and grid upgrades while targeting 2050 emissions goals.
Key Points
Delay moves EV and heating targets to 2035, tweaks mandates, and shifts energy policy, keeping the 2050 net zero goal.
✅ EV sales ban shifts to 2035; ZEV mandate trajectory unchanged
✅ Heat pump grants rise to £7,500; boiler phase-out eased
✅ North Sea oil, onshore wind, grid and nuclear plans advance
British Prime Minister Rishi Sunak has said he would delay targets for changing cars and domestic heating to maintain the consent of the British people in the switch to net zero as part of the global energy transition under way.
Sunak said Britain was still committed to achieving net zero emissions by 2050, similar to Canada's race to net zero goals, and denied watering down its climate targets.
Here are some of the current emissions targets for Britain's top polluting sectors and how the announcement impacts them.
TRANSPORTATION
Transport accounts for more than a third (34%) of Britain's total carbon dioxide (CO2) emissions, the most of any sector.
Sunak announced a delay to introducing a ban on new petrol and diesel cars and vans. It will now come into force in 2035 rather than in 2030.
There were more than 1.1 million electric cars in use on UK roads as of April - up by more than half from the previous year to account for roughly one in every 32 cars, according to the country's auto industry trade body.
The current 2030 target was introduced in November 2020 as a central part of then-Prime Minister Boris Johnson's plans for a "green revolution". As recently as Monday, transport minister Mark Harper restated government support for the policy.
Britain’s independent climate advisers, the Climate Change Committee, estimated a 2030 phase out of petrol, diesel and hybrid vehicles could save up to 110 million tons of carbon dioxide equivalent emissions compared with a 2035 phase out.
ohnson's policy already allowed for the continued sale of hybrid cars and vans that can drive long stretches without emitting carbon until 2035.
The transition is governed by a zero-emission vehicle (ZEV) mandate, a shift echoed by New Zealand's electricity transition debates, which means manufacturers must ensure an increasing proportion of the vehicles they sell in the UK are electric.
The current proposal is for 22% of a car manufacturer's sales to be electric in 2024, rising incrementally each year to 100% in 2035.
The government said on Wednesday that all sales of new cars from 2035 would still be zero emission.
Sunak said that proposals that would govern how many passengers people should have in a car, or proposals for new taxes to discourage flying, would be scrapped.
RESIDENTIAL
Residential emissions, the bulk of which come from heating, make up around 17% of the country's CO2 emissions.
The government has a target to reduce Britain's energy consumption from buildings and industry by 15% by 2030, and had set a target to phase out installing new and replacement gas boilers from 2035, as the UK moves towards heat pumps, amid an IEA report on Canada's power needs noting more electricity will be required.
Sunak said people would have more time to transition, and the government said that off-gas-grid homes could continue to install oil and liquefied petroleum gas boilers until 2035, rather than being phased out from 2026.
However, his announcements that the government would not force anyone to rip out an existing boiler and that people would only have to make the switch when replacing one from 2035 restated existing policy.
He also said there would be an exemption so some households would never have to switch, but the government would increase an upgrade scheme that gives people cash to replace their boilers by 50% to 7,500 pounds ($9,296.25).
Currently almost 80% of British homes are heated by gas boilers. In 2022, 72,000 heat pumps were installed. The government had set a target of 600,000 heat pump installations per year by 2028.
A study for Scottish Power and WWF UK in June found that 6 million homes would need to be better insulated by 2030 to meet the government's target to reduce household energy consumption, but current policies are only expected to deliver 1.1 million.
The study, conducted by Frontier Economics, added that 1.5 million new homes would still need heat pumps installed by 2030.
Sunak said that the government would subsidise people who wanted to make their homes energy efficient but never force a household to do it.
The government also said it was scrapping policies that would force landlords to upgrade the energy efficiency of their properties.
ENERGY
The energy sector itself is a big emitter of greenhouse gases, contributing around a quarter of Britain's emissions, though the UK carbon tax on coal has driven substantial cuts in coal-fired electricity in recent years.
In July, Britain committed to granting hundreds of licences for North Sea oil and gas extraction as part of efforts to become more energy independent.
Sunak said he would not ban new oil and gas in the North Sea, and that future carbon budgets for governments would have to be considered alongside the plans to meet them.
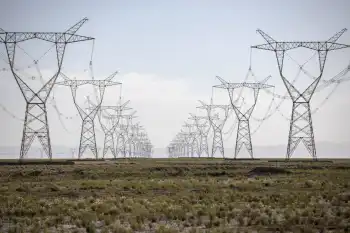
He said the government would shortly bring forward new plans for energy infrastructure to improve Britain's grid, including the UK energy plan, while speeding up planning.
Offshore wind power developers warned earlier this month that Britain's climate goals could be at risk, even as efforts like cleaning up Canada's electricity highlight the importance of power-sector decarbonization, after a subsidy auction for new renewable energy projects did not attract any investment in those planned off British coasts.
Britain is aiming to develop 50 gigawatts (GW) of offshore wind capacity by 2030, up from around 14 GW now.
Sunak highlighted that Britain is lifting a ban on onshore wind, investing in carbon capture and building new nuclear power stations.
Related News