Huge wind potential on U.S. east coast

By Reuters


NFPA 70e Training - Arc Flash

Our customized live online or in‑person group training can be delivered to your staff at your location.

  • Live Online
  • 6 hours Instructor-led
  • Group Training Available
Regular Price:
$199
Coupon Price:
$149
Reserve Your Seat Today
The densely populated U.S. East Coast could meet close to half its current electric demand by relying on offshore wind turbines, a study by an ocean conservation group found.

North Carolina, South Carolina, New Jersey and Virginia offer the most potential for easily captured wind energy, according to the Oceana study, which estimates that the 13 coastal states could together generate 127 gigawatts of power.

That represents the potential for far more wind power than the United States currently generates. At the end of 2009, the nation's land-based turbines were capable of producing some 35,000 megawatts of power — enough to meet the needs of 28 million typical American homes.

Investment in new wind turbines has surged in recent years, boosting sales at turbine makers including General Electric Co, Vestas Wind Systems A/S and Siemens AG.

However, all the U.S. wind farms built so far are on land. Advocates of offshore wind installations, led by backers of the Cape Wind facility proposed off the Cape Cod beach area in Massachusetts, have been working for almost a decade to try to win approval to build offshore turbines.

Opponents of Cape Wind argue that it could harm fisheries as well as sully views in a region dependent on tourism.

Oceana argues that wind offers an attractive alternative to offshore oil and natural gas drilling, particularly in the wake of the April BP Plc rig explosion, which led to an undersea leak that poured oil and gas into the Gulf of Mexico for 153 days.

"Our research revealed that harnessing offshore wind power in Atlantic waters is a much more cost-effective way to generate energy than oil and gas drilling," said Jacqueline Savitz, an author of the report.

Oceana argued the electricity generated by wind off the East Coast would save $36 billion in energy costs over a 20-year period and create 133,000 to 212,000 installation and maintenance jobs a year.

Hitting the 127 gigawatt number could mean installing 30,000 to 50,000 of the spinning turbines along the U.S. East Coast. That would be the equivalent of more than 200 projects the size of Cape Wind, which could become the nation's first wind farm.

That figure assumes current turbines sizes of 2.5 megawatts to 4 megawatts. But Savitz suggested the estimated figure of 30,000 to 50,000 turbines could well decline as turbine sizes increase.

"If you assume this is all coming into play over 10 or 15 years, these things are expected to get bigger and bigger," Savitz said.

Oceana's analysis of the East Coast's potential to generate power from the wind leaves out the New England states of New Hampshire and Maine, because their shorelines drop away quickly to deeper waters where it would be more difficult for developers to install turbines.

That same concern has kept developers away from the West Coast.

Cape Wind is not the only wind farm proposed off the Eastern seaboard. Developers are also working on projects off Rhode Island, Delaware and New Jersey.

Related News

Britain Goes Full Week Without Coal Power

Britain Coal-Free Week signals a historic shift to clean energy, with zero coal power, increased natural gas and renewables, lower greenhouse gas emissions, and ambitious UK energy policy targeting a 2025 coal phase-out and decarbonization.


Key Points

A seven-day period with no coal power in the UK, signaling cleaner energy and progress on emission reductions.

✅ Seven days of zero coal generation in the UK

✅ Natural gas and renewables dominated the electricity mix

✅ Coal phase-out targeted by 2025; emissions cuts planned


For the first time in a century, Britain weaned itself off of coal consumption for an entire week, a coal-free power record for the country.

Reuters reported that Britain went seven days without relying on any power generated by coal-powered stations as the share of coal in the grid continued to hit record lows.

The accomplishment is symbolic of a shift to more clean energy sources, with wind surpassing coal in 2016 and the UK leading the G20 in wind share as of recent years; Britain was home to the first coal-powered plant back in the 1880s.

Today, Britain has some aggressive plans in place to completely eliminate its coal power generation permanently by 2025, with a plan to end coal power underway. In addition, Britain aims to cut its total greenhouse gas emissions by 80 percent from 1990 levels within the next 30 years.

Natural gas was the largest source of power for Britain in 2018, providing 39 percent of the nation's total electricity, as the Great Britain generation dashboard shows. Coal contributed only about 5 percent, though low-carbon generation stalled in 2019 according to reports. Burning natural gas also produces greenhouse gases, but it is much more efficient and greener than coal.

In the U.S., 63.5 percent of electricity generated in 2018 came from fossil fuels. About 35.1 percent was produced from natural gas and 27.4 percent came from coal. In addition, 19.3 percent of electricity came from nuclear power and 17.1 percent came from renewable energy sources, according to the U.S. Energy Information Administration.


Related News

View more

Experiment Shows We Can Actually Generate Electricity From The Night Sky

Nighttime thermoradiative power converts outgoing infrared radiation into electricity using semiconductor photodiodes, leveraging negative illumination and sky cooling to harvest renewable energy from Earth-to-space heat flow when solar panels rest, regardless of weather.


Key Points

Nighttime thermoradiative power converts Earth's outgoing infrared heat into electricity using semiconductor diodes.

✅ Uses negative illumination to tap Earth-to-space heat flow

✅ Infrared semiconductor photodiodes generate small nighttime current

✅ Theoretical output ~4 W/m^2; lab demo reached 64 nW/m^2


There's a stark contrast between the freezing temperatures of space and the relatively balmy atmosphere of Earth, and that contrast could help generate electricity, scientists say – and alongside concepts such as space-based solar power, utilizing the same optoelectronic physics used in solar panels. The obvious difference this would have compared with solar energy is that it would work during the night time, a potential source of renewable power that could keep on going round the clock and regardless of weather conditions.

Solar panels are basically large-scale photodiodes - devices made out of a semiconducting material that converts the photons (light particles) coming from the Sun into electricity by exciting electrons in a material such as silicon, while concepts like space solar beaming could complement them during adverse weather.

In this experiment, the photodiodes work 'backwards': as photons in the form of infrared radiation - also known as heat radiation - leave the system, a small amount of energy is produced, similar to how raindrop electricity harvesting taps ambient fluxes in other experiments.

This way, the experimental system takes advantage of what researchers call the "negative illumination effect" – that is, the flow of outgoing radiation as heat escapes from Earth back into space. The setup explained in the new study uses an infrared semiconductor facing into the sky to convert this flow into electrical current.

"The vastness of the Universe is a thermodynamic resource," says one of the researchers, Shanhui Fan from Stanford University in California.

"In terms of optoelectronic physics, there is really this very beautiful symmetry between harvesting incoming radiation and harvesting outgoing radiation."

It's an interesting follow-up to a research project Fan participated in last year: a solar panel that can capture sunlight while also allowing excess heat in the form of infrared radiation to escape into space.

In the new study, this "energy harvesting from the sky" process can produce a measurable amount of electricity, the researchers have shown – though for the time being it's a long way from being efficient enough to contribute to our power grids, but advances in peer-to-peer energy sharing could still make niche deployments valuable.

In the team's experiments they were able to produce 64 nanowatts per square metre (10.8 square feet) of power – only a trickle, but an amazing proof of concept nevertheless. In theory, the right materials and conditions could produce a million times more than that, and analyses of cheap abundant electricity show how rapidly such advances compound, reaching about 4 watts per square metre.

"The amount of power that we can generate with this experiment, at the moment, is far below what the theoretical limit is," says one of the team, Masashi Ono from Stanford.

When you consider today's solar panels are able to generate up to 100-200 watts per square metre, and in China solar is cheaper than grid power across every city, this is obviously a long way behind. Even in its earliest form, though, it could be helpful for keeping low-power devices and machines running at night: not every renewable energy device needs to power up a city.

Now that the researchers have proved this can work, the challenge is to improve the performance of the experimental device. If it continues to show promise, the same idea could be applied to capture energy from waste heat given off by machinery, and results in humidity-powered generation suggest ambient sources are plentiful.

"Such a demonstration of direct power generation of a diode facing the sky has not been previously reported," explain the researchers in their published paper.

"Our results point to a pathway for energy harvesting during the night time directly using the coldness of outer space."

The research has been published in Applied Physics Letters.


Related News

View more

Spain's power demand in April plummets under COVID-19 lockdown

Spain Electricity Demand April 2020 saw a 17.3% year-on-year drop as COVID-19 lockdown curbed activity; renewables and wind power lifted the emission-free share, while combined cycle plants dominated islands, per REE data.


Key Points

A 17.3% y/y decline amid COVID-19 lockdown, with 47.9% renewables and wind at 21.3% of the national power mix.

✅ Mainland demand -17%; Balearic -27.6%; Canary -20.3%.

✅ Emission-free share: 49.7% on the peninsula in April.

✅ Combined cycle led islands; coal absent in Balearics.


Demand for electricity in Spain dropped by 17.3% year-on-year to an estimated 17,104 GWh in April, aligning with a 15% global daily demand dip during the pandemic, while the country’s economy slowed down under the national state of emergency and lockdown measures imposed to curb the spread of COVID-19.

According to the latest estimates by Spanish grid operator Red Electrica de Espana (REE), the decline in demand was registered across Spain’s entire national territory, similar to a 10% UK drop during lockdown. On the mainland, it decreased by 17% to 16,191 GWh, while on the Balearic and the Canary Islands it plunged by 27.6% and 20.3%, respectively.

Renewables accounted for 47.9% of the total national electricity production in April, echoing Britain’s cleanest electricity trends during lockdown. Wind power production went down 20% year-on-year to 3,730 GWh, representing a 21.3% share in the total power mix.

During April, electricity generation in the peninsula was mostly based on emission-free technologies, reflecting an accelerated power-system transition across Europe, with renewables accounting for 49.7%. Wind farms produced 3,672 GWh, 20.1% less compared to April 2019, while contributing 22% to the power mix, even as global demand later surpassed pre-pandemic levels in subsequent periods.

In the Balearic Islands, electricity demand of 323,296 MWh was for the most part met by combined cycle power plants, even as some European demand held firm in later lockdowns, which accounted for 78.3% of the generation. Renewables and emission-free technologies had a combined share of 6.4%, while coal was again absent from the local power mix, completing now four consecutive months without contributing a single MWh.

In the Canary Islands system, demand for power decreased to 558,619 MWh, even as surging demand elsewhere strained power systems across the world. Renewables and emission-free technologies made up 14.3% of the mix, while combined cycle power plants led with a 45.3% share.


Related News

View more

U.S. Electricity and natural gas prices explained

Energy Pricing Factors span electricity generation, transmission, and distribution costs, plus natural gas supply-demand, renewables, seasonal peaks, and wholesale pricing effects across residential, commercial, and industrial customers, usage patterns, weather, and grid constraints.


Key Points

They are the costs and market forces driving electricity and natural gas prices, from generation to delivery and demand.

✅ Generation, transmission, distribution shape electricity rates

✅ Gas prices hinge on supply, storage, imports/exports

✅ Demand shifts: weather, economy, and fuel alternatives


There are a lot of factors that affect energy prices globally. What’s included in the price to heat homes and supply them with electricity may be a lot more than some people may think.

Electricity
Generating electricity is the largest component of its price, according to the U.S. Energy Information Administration (EIA). Generation accounts for 56% of the price of electricity, while distribution and transmission account for 31% and 13% respectively.

Homeowners and businesses pay more for electricity than industrial companies, and U.S. electricity prices have recently surged, highlighting broader inflationary pressures. This is because industrial companies can take electricity at higher voltages, reducing transmission costs for energy companies.

“Industrial consumers use more electricity and can receive it at higher voltages, so supplying electricity to these customers is more efficient and less expensive. The price of electricity to industrial customers is generally close to the wholesale price of electricity,” EIA explains.

NYSEG said based on the average use of 600 kilowatt-hours per month, its customers spent the most money on delivery and transition charges in 2020, 57% or about $42, and residential electricity bills increased 5% in 2022 after inflation, according to national data. They also spent on average 35% (~$26) on supply charges and 8% (~$6) on surcharges.

Electricity prices are usually higher in the summer. Why? Because energy companies use sources of electricity that cost more money. It used to be that renewable sources, like solar and wind, were the most expensive sources of energy but increased technological advances have changed this, according to the International Energy Agency’s 2021 World Energy Outlook.

“In most markets, solar PV or wind now represents the cheapest available source of new electricity generation. Clean energy technology is becoming a major new area for investment and employment – and a dynamic arena for international collaboration and competition,” the report said.

Natural gas
The price of natural gas is driven by supply and demand. If there is more supply, prices are generally lower. If there is not as much supply, prices are generally higher the EIA explains. On the other side of the equation, more demand can also increase the price and less demand can decrease the price.

High natural gas prices mean people turn their home thermostats down a few degrees to save money, so the EIA said reduced demand can encourage companies to produce more natural gas, which would in turn help lower the cost. Lower prices will sometimes cause companies to reduce their production, therefore causing the price to rise.

The three major supply factors that affect prices: the amount of natural gas produced, how much is stored, and the volume of gas imported and exported. The three major demand factors that affect price are: changes in winter/summer weather, economic growth, and the broader energy crisis dynamics, as well as how much other fuels are available and their price, said EIA.

To think the price of natural gas is higher when the economy is thriving may sound counterintuitive but that’s exactly what happens. The EIA said this is because of increases in demand.


Related News

View more

As Alberta electricity generators switch to gas, power price cap comes under spotlight

Alberta Energy-Only Electricity Market faces capacity market debate, AESO price cap review, and coal-to-gas shifts by TransAlta and Capital Power, balancing reliability with volatility as investment signals evolve across Alberta's grid.


Key Points

An energy market paying generators only for electricity sold, with AESO oversight and a price cap guiding new capacity.

✅ AESO reviewing $999 per MW-h wholesale price cap.

✅ UCP retained energy-only; capacity market plan cancelled.

✅ TransAlta and Capital Power shift to coal-to-gas.


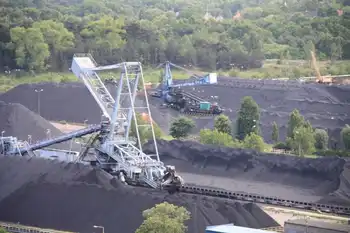
The Kenney government’s decision to cancel the redesign of Alberta’s electricity system to a capacity market won’t side-track two of the province’s largest power generators from converting coal-fired facilities to burn natural gas as part of Alberta’s shift from coal to cleaner energy overall.

But other changes could be coming to the province’s existing energy-only electricity market — including the alteration of the $999 per megawatt-hour (MW-h) wholesale price cap in Alberta.

The heads of TransAlta Corp. and Capital Power Corp. are proceeding with strategies to convert existing coal-fired power generating facilities to use natural gas in the coming years.

Calgary-based TransAlta first announced in 2017 that it would make the switch, as the NDP government was in the midst of overhauling the electricity sector and wind generation began to outpace coal in the province.

At the time, the Notley government planned to phase out coal-fired power by 2030, even as Alberta moved to retire coal by 2023 in practice, and shift Alberta into an electricity capacity market in 2021.

Such a move, made on the recommendation of the Alberta Electric System Operator (AESO), was intended to reduce price volatility and ensure system reliability.

Under the energy-only market, generators receive payments for electricity produced and sold into the grid. In a capacity market, generators are also paid for having power available on demand, regardless of how often they sell energy into the provincial grid.

The UCP government decided last month to ditch plans for a capacity market after consulting with the sector, saying it would be better for consumers.

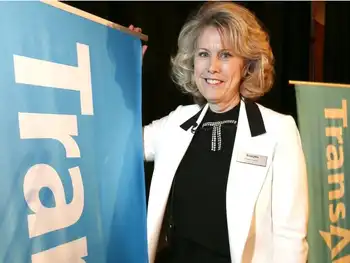
On a conference call, TransAlta CEO Dawn Farrell said the company will convert coal-fired generating plants to burn gas, although it may alter the mix between simple conversions and switching to so-called “hybrid” plants.

(A hybrid conversion is a larger and more-expensive switch, as it includes installing a new gas turbine and heat-recovery steam generator, but it creates a highly efficient combined cycle unit.)

“Our view is fundamentally that carbon will be priced over the next 20 years no matter what,” she said Friday.

“We cannot get off coal fast enough in this company, and gas right now in Alberta is extremely inexpensive…

“So our coal-to-gas strategy is completely predicated on our belief that it’s not smart to be in carbon-intensive fuels for the future.”

Elsewhere in Canada, the Stop the Shock campaign has advocated for reviving coal power, underscoring ongoing policy debates.

The company said it’s planning the coal-to-gas conversion and re-powering of some or all of the units at its Keephills and Sundance facilities to gas-fired generation sometime between 2020 and 2023.

Similarly, Capital Power CEO Brian Vaasjo said the Edmonton-based company is moving ahead with a project that will allow it to burn both coal and natural gas at its Genesee generating station, even as Ontario’s energy minister sought to explore a halt to natural gas generation elsewhere.

In June, the company announced it would spend an estimated $50 million between 2019 and 2021 to allow it to use gas at the facility.

“What we’re doing is going to be dual fuel, so we will be able to operate 100 per cent natural gas or 100 per cent coal and everything in between,” Vaasjo said in an interview.

“You can expect to see we will be burning coal in the winter when natural gas prices are high, and we will be burning natural gas in summer when gas prices are real low.”

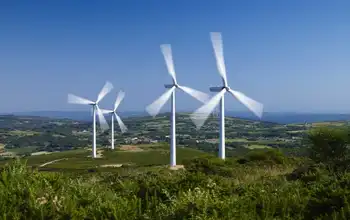
The transition comes as the government’s decision to stick with the energy-only market has been welcomed by players in the industry, and as Alberta's electricity future increasingly leans on wind resources.

A study by electricity consultancy EDC Associates found the capacity market would result in consumers paying an extra $1.4 billion in direct costs in 2021-22, as it required more generation to come online earlier than expected.

These additional costs would have accumulated to $10 billion by 2030, said EDC chief executive Duane-Reid Carlson.

For Capital Power, the decision to stick with the current system makes the province more investable in the future. Vaasjo said there was great uncertainty about the transition to a capacity market, and the possibility of rules shifting further.

Officials with Enmax Corp. said the city-owned utility would not have invested in future generation under the proposed capacity market.

“There is no short-term need (today) for new generation, so we’re just looking at the market and saying, ‘OK, as it evolves, we will see what happens,’” said Enmax vice-president Tim Boston.

Sticking with the energy-only market doesn’t mean Alberta will keep the existing rules.

In a July 25 letter, Alberta Energy Minister Sonya Savage directed AESO chair Will Bridge to examine if changes to the existing market are needed and report back by July 2020.

AESO, which manages the power grid, has been asked to investigate whether the current price cap of $999 per megawatt-hour (MW-h) should be changed.

The price ceiling hasn’t been altered since the energy-only market was implemented by the Klein government about two decades ago.

While allowing prices to go higher would increase volatility, reflecting lessons from Europe’s power crisis about scarcity pricing, during periods of rising demand and limited supply, it would send a signal to generators when investment in new generation is required, said Kent Fellows, a research associate at the University of Calgary’s School of Public Policy.

“Keeping the price (cap) too low could end up costing us more in the long run,” he said.

In a 2016 report, AESO said the province examined raising the price cap to $5,000 per MW-h, but “determined that it was unlikely to be successful in attracting investment due to increased price volatility.”

However, the amount of future generation that will be required in Alberta has been scaled back by the province.

In the United States, the Electricity Reliability Council of Texas (ERCOT) allows wholesale power prices in the state to climb to a cap of $9,000 per megawatt hours as demand rises — as it did Tuesday in the midst of a heat wave, according to Bloomberg.

Jim Wachowich, legal counsel for the Consumers’ Coalition of Alberta, said while few players are exposed to spot electricity prices, he has yet to be convinced raising the cap would be good for Albertans.

“Someone has to show me the evidence, and I suspect that’s what the minister has asked the AESO to do,” he said.

Generators say they believe some tinkering is needed to the energy-only market to ensure new generation is built when it’s required.

“The No. 1 change that the government has to … think about is in pricing,” added Farrell.

“If you don’t have enough of a price signal in an energy-only market to attract new capital, you won’t get new capital — and you’ll run up against the wall.”


Related News

View more

The Netherlands Outpaces Canada in Solar Power Generation

Netherlands vs Canada Solar Power compares per capita capacity, renewable energy policies, photovoltaics adoption, rooftop installations, grid integration, and incentives like feed-in tariffs and BIPV, highlighting efficiency, costs, and public engagement.


Key Points

Concise comparison of per capita capacity, policies, technology, and engagement in Dutch and Canadian solar adoption.

✅ Dutch per capita PV capacity exceeds Canada's by wide margin.

✅ Strong incentives: net metering, feed-in tariffs, rooftop focus.

✅ Climate, grid density, and awareness drive higher yields.


When it comes to harnessing solar power, the Netherlands stands as a shining example of efficient and widespread adoption, far surpassing Canada in solar energy generation per capita. Despite Canada's vast landmass and abundance of sunlight, the Netherlands has managed to outpace its North American counterpart, which some experts call a solar power laggard in solar energy production. This article explores the factors behind the Netherlands' success in solar power generation and compares it to Canada's approach.

Solar Power Capacity and Policy Support

The Netherlands has rapidly expanded its solar power capacity in recent years, driven by a combination of favorable policies, technological advancements, and public support. According to recent data, the Netherlands boasts a significantly higher per capita solar power capacity compared to Canada, where demand for solar electricity lags relative to deployment in many regions, leveraging its smaller geographical size and dense population centers to maximize solar panel installations on rooftops and in urban areas.

In contrast, Canada's solar energy development has been slower, despite having vast areas of suitable land for solar farms. Challenges such as regulatory hurdles, varying provincial policies, and the high initial costs of solar installations have contributed to a more gradual adoption of solar power across the country. However, provinces like Ontario have seen significant growth in solar installations due to supportive government incentives and favorable feed-in tariff programs, though growth projections were scaled back after Ontario scrapped a key program.

Innovation and Technological Advancements

The Netherlands has also benefited from ongoing innovations in solar technology and efficiency improvements. Dutch companies and research institutions have been at the forefront of developing new solar panel technologies, improving efficiency rates, and exploring innovative applications such as building-integrated photovoltaics (BIPV). These advancements have helped drive down the cost of solar energy and increase its competitiveness with traditional fossil fuels.

In contrast, while Canada has made strides in solar technology research and development, commercialization and widespread adoption have been more restrained due to factors like market fragmentation and the country's reliance on other energy sources such as hydroelectricity.

Public Awareness and Community Engagement

Public awareness and community engagement play a crucial role in the Netherlands' success in solar power adoption. The Dutch government has actively promoted renewable energy through public campaigns, educational programs, and financial incentives for homeowners and businesses to install solar panels. This proactive approach has fostered a culture of energy conservation and sustainability among the Dutch population.

In Canada, while there is growing public support for renewable energy, varying levels of awareness and engagement across different provinces have impacted the pace of solar energy adoption. Provinces like British Columbia and Alberta have seen increasing interest in solar power, driven by environmental concerns, technological advancements, and economic benefits, as the country is set to hit 5 GW of installed capacity in the near term.

Climate and Geographic Considerations

Climate and geographic considerations also influence the disparity in solar power generation between the Netherlands and Canada. The Netherlands, despite its northern latitude, benefits from relatively mild winters and a higher average annual sunlight exposure compared to most regions of Canada. This favorable climate has facilitated higher solar energy yields and made solar power a more viable option for electricity generation.

In contrast, Canada's diverse climate and geography present unique challenges for solar energy deployment. Northern regions experience extended periods of darkness during winter months, limiting the effectiveness of solar panels in those areas. Despite these challenges, advancements in energy storage technologies and hybrid solar-diesel systems are making solar power increasingly feasible in remote and off-grid communities across Canada, even as Alberta faces expansion challenges related to grid integration and policy.

Future Prospects and Challenges

Looking ahead, both the Netherlands and Canada face opportunities and challenges in expanding their respective solar power capacities. In the Netherlands, continued investments in solar technology, grid infrastructure upgrades, and policy support will be crucial for maintaining momentum in renewable energy development.

In Canada, enhancing regulatory consistency, scaling up solar installations in urban and rural areas, and leveraging emerging technologies will be essential for narrowing the gap with global leaders in solar energy generation and for seizing opportunities in the global electricity market as the energy transition accelerates.

In conclusion, while the Netherlands currently generates more solar power per capita than Canada, with the Prairie Provinces poised to lead growth in the Canadian market, both countries have unique strengths and challenges in their pursuit of a sustainable energy future. By learning from each other's successes and leveraging technological advancements, both nations can further accelerate the adoption of solar power and contribute to global efforts to combat climate change.


Related News

View more

Sign Up for Electricity Forum’s Newsletter

Stay informed with our FREE Newsletter — get the latest news, breakthrough technologies, and expert insights, delivered straight to your inbox.

Electricity Today T&D Magazine Subscribe for FREE

Stay informed with the latest T&D policies and technologies.
  • Timely insights from industry experts
  • Practical solutions T&D engineers
  • Free access to every issue

Download the 2025 Electrical Training Catalog

Explore 50+ live, expert-led electrical training courses –

  • Interactive
  • Flexible
  • CEU-cerified