Coal plant closer to 2025 shutdown target

By Seattle Post Intelligencer


Protective Relay Training - Basic

Our customized live online or in‑person group training can be delivered to your staff at your location.

  • Live Online
  • 12 hours Instructor-led
  • Group Training Available
Regular Price:
$699
Coupon Price:
$599
Reserve Your Seat Today
A bill that would gradually shut down Washington's largest coal-fired power plant cleared another hurdle, paving the way to end coal-burning as a source of electricity in the Northwest.

The House overwhelmingly approved Senate Bill 5769, which would shut down one of two boilers at the TransAlta plant by 2020 and phase out coal-burning by 2025. In Oregon, Portland General Electric plans to close that state's only coal-fired power plant by the end of 2020.

TransAlta, state officials and environmental groups negotiated a deal last month to close the plant in Centralia, about 85 miles south of Seattle. The measure requires the Canada-based company to provide $55 million for economic development and other assistance, and to install additional air pollution controls to further reduce emissions of nitrogen oxides at the plant.

In exchange, TransAlta would be allowed enter into long-term agreements to sell its electricity to other utilities, which is currently prohibited by state law.

Lawmakers in the House made mostly technical changes to the bill, which passed by an 87-9 vote. It now goes back to the Senate for approval, but is expected to pass the Legislature.

"This is a great milestone," said Doug Howell, campaign director of the Sierra Club's Coal-free Washington campaign. He said the bill would reduce the harm to human health and the environment from coal pollution.

KC Golden, policy director with Climate Solutions, said the bill is an example of all parties agreeing to make the transition away from coal. "I'm delighted that it's going to happen in a way that gives everybody time to make the right investments."

The TransAlta facility is the state's top point source of greenhouse gases, toxic mercury and nitrogen oxide, and second in sulfur dioxide that causes acid rain.

The company had been under pressure this session to shut down the facility as early as 2015. TransAlta had said it needed time to develop other renewable energy, to decommission the facility and to allow half of its workers to reach retirement age.

Rep. Ed Orcutt, R-Kalama, voted against the bill, saying before the vote that he didn't like that the company was forced to the negotiating table. "Who is going to be the next target of the environmental community?" Orcutt asked.

But Rep. Gary Alexander, R-Olympia, called it a good compromise between environmental stewardship and responsibility to the company as well as the community.

"It gives some predictability to addressing the conversion," he said.

Related News

BC Hydro activates "winter payment plan"

BC Hydro Winter Payment Plan lets customers spread electricity bills over six months during cold weather, easing costs amid colder-than-average temperatures in British Columbia, with low-income conservation support, energy-saving kits, and insulation upgrades.


Key Points

Allows BC Hydro customers to spread winter electricity bills over six months, with added low-income efficiency support.

✅ Spread Dec-Mar bills across six months

✅ Eases costs during colder-than-average temperatures

✅ Includes low-income conservation and energy-saving kits


As colder temperatures set in across the province again this weekend, BC Hydro says it is activating its winter payment plan to give customers the opportunity to spread out their electricity bills as demand can reach record levels during extreme cold periods.

"Our meteorologists are predicting colder-than-average temperatures will continue over the next of couple of months and we want to provide customers with help to manage their payments," said Chris O'Riley, BC Hydro's president.

All BC Hydro customers will be able to spread payments from the billing period spanning Dec. 1, 2017 to March 31, 2018 over a six-month period.

Cold weather in the second half of December 2017 led to surging electricity demand that was higher than the previous 10-year average and has at times hit all-time highs during peak usage periods, according to BC Hydro.

Hydro operations also respond to summer conditions, as drought and low rainfall can force adjustments in power generation strategies.

People who heat their homes with electricity — about 40 per cent of British Columbians —  have the highest overall bills in the province, $197 more in December than in July, when air conditioning use can affect energy costs.

This is the second year the Crown corporation has activated a cold-weather payment plan, part of broader customer assistance programs it offers.  

BC Hydro has also increased funding for its low-income conservation programs by $2.2 million for a total of $10 million over the next three years. 

The low-income program provides energy-saving kits that include things like free energy assessments, insulation upgrades and weather stripping. 


Related News

View more

Canadian Scientists say power utilities need to adapt to climate change

Canada Power Grid Climate Resilience integrates extreme weather planning, microgrids, battery storage, renewable energy, vegetation management, and undergrounding to reduce outages, harden infrastructure, modernize utilities, and safeguard reliability during storms, ice events, and wildfires.


Key Points

Canada's grid resilience hardens utilities against extreme weather using microgrids, storage, renewables, and upgrades.

✅ Grid hardening: microgrids, storage, renewable integration

✅ Vegetation management reduces storm-related line contact

✅ Selective undergrounding where risk and cost justify


The increasing intensity of storms that lead to massive power outages highlights the need for Canada’s electrical utilities to be more robust and innovative, climate change scientists say.

“We need to plan to be more resilient in the face of the increasing chances of these events occurring,” University of New Brunswick climate change scientist Louise Comeau said in a recent interview.

The East Coast was walloped this week by the third storm in as many days, with high winds toppling trees and even part of a Halifax church steeple, underscoring the value of storm-season electrical safety tips for residents.

Significant weather events have consistently increased over the last five years, according to the Canadian Electricity Association (CEA), which has tracked such events since 2003.

#google#

Nearly a quarter of total outage hours nationally in 2016 – 22 per cent – were caused by two ice storms, a lightning storm, and the Fort McMurray fires, which the CEA said may or may not be classified as a climate event.

“It (climate change) is putting quite a lot of pressure on electricity companies coast to coast to coast to improve their processes and look for ways to strengthen their systems in the face of this evolving threat,” said Devin McCarthy, vice president of public affairs and U.S. policy for the CEA, which represents 40 utilities serving 14 million customers.

The 2016 figures – the most recent available – indicate the average Canadian customer experienced 3.1 outages and 5.66 hours of outage time.

McCarthy said electricity companies can’t just build their systems to withstand the worst storm they’d dealt with over the previous 30 years. They must prepare for worse, and address risks highlighted by Site C dam stability concerns as part of long-term planning.

“There needs to be a more forward looking approach, climate science led, that looks at what do we expect our system to be up against in the next 20, 30 or 50 years,” he said.

Toronto Hydro is either looking at or installing equipment with extreme weather in mind, Elias Lyberogiannis, the utility’s general manager of engineering, said in an email.

That includes stainless steel transformers that are more resistant to corrosion, and breakaway links for overhead service connections, which allow service wires to safely disconnect from poles and prevents damage to service masts.

Comeau said smaller grids, tied to electrical systems operated by larger utilities, often utilize renewable energy sources such as solar and wind as well as battery storage technology to power collections of buildings, homes, schools and hospitals.

“Capacity to do that means we are less vulnerable when the central systems break down,” Comeau said.

Nova Scotia Power recently announced an “intelligent feeder” pilot project, which involves the installation of Tesla Powerwall storage batteries in 10 homes in Elmsdale, N.S., and a large grid-sized battery at the local substation. The batteries are connected to an electrical line powered in part by nearby wind turbines.

The idea is to test the capability of providing customers with back-up power, while collecting data that will be useful for planning future energy needs.

Tony O’Hara, NB Power’s vice-president of engineering, said the utility, which recently sounded an alarm on copper theft, was in the late planning stages of a micro-grid for the western part of the province, and is also studying the use of large battery storage banks.

“Those things are coming, that will be an evolution over time for sure,” said O’Hara.

Some solutions may be simpler. Smaller utilities, like Nova Scotia Power, are focusing on strengthening overhead systems, mainly through vegetation management, while in Ontario, Hydro One and Alectra are making major investments to strengthen infrastructure in the Hamilton area.

“The number one cause of outages during storms, particularly those with high winds and heavy snow, is trees making contact with power lines,” said N.S. Power’s Tiffany Chase.

The company has an annual budget of $20 million for tree trimming and removal.

“But the reality is with overhead infrastructure, trees are going to cause damage no matter how robust the infrastructure is,” said Matt Drover, the utility’s director for regional operations.

“We are looking at things like battery storage and a variety of other reliability programs to help with that.”

NB Power also has an increased emphasis on tree trimming and removal, and now spends $14 million a year on it, up from $6 million prior to 2014.

O’Hara said the vegetation program has helped drive the average duration of power outages down since 2014 from about three hours to two hours and 45 minutes.

Some power cables are buried in both Nova Scotia and New Brunswick, mostly in urban areas. But both utilities maintain it’s too expensive to bury entire systems – estimated at $1 million per kilometre by Nova Scotia Power.

The issue of burying more lines was top of mind in Toronto following a 2013 ice storm, but that’s city’s utility also rejected the idea of a large-scale underground system as too expensive – estimating the cost at around $15 billion, while Ontario customers have seen Hydro One delivery rates rise in recent adjustments.

“Having said that, it is prudent to do so for some installations depending on site specific conditions and the risks that exist,” Lyberogiannis said.

Comeau said lowering risks will both save money and disruption to people’s lives.

“We can’t just do what we used to do,” said Xuebin Zhang, a senior climate change scientist at Environment and Climate Change Canada.

“We have to build in management risk … this has to be a new norm.”


Related News

View more

By Land and Sea, Clean Electricity Needs to Lead the Way

Martha's Vineyard 100% Renewable Energy advances electrification across EVs, heat pumps, distributed solar, offshore wind, microgrids, and battery storage, cutting emissions, boosting efficiency, and strengthening grid resilience for storms and sea-level rise.


Key Points

It is an islandwide plan to electrify transport and buildings using wind, solar, storage, and a modern resilient grid.

✅ Electrify transport: EV adoption and SSA hybrid-electric ferries.

✅ Deploy heat pumps for efficient heating and cooling in buildings.

✅ Modernize the grid: distributed solar, batteries, microgrids, VPP.


Over the past year, it has become increasingly clear that climate change is accelerating. Here in coastal New England, annual temperatures and precipitation have risen more quickly than expected, tidal flooding is now commonplace, and storms have increased in frequency and intensity. The window for avoiding the worst consequences of a climate-changed planet is closing.

At their recent special town meeting, Oak Bluffs citizens voted to approve the 100 per cent renewable Martha’s Vineyard warrant article; now, all six towns have adopted the same goals for fossil fuel reduction and green electricity over the next two decades. Establishing these targets for the adoption of renewable energy, though, is only an initial step. Town and regional master plans for energy transformation are being developed, but this is a whole-community effort as well. Now is the time for action.

There is much to do to combat climate change, but our most important task is to transition our energy system from one heavily dependent on fossil fuels to one that is based on clean electricity. The good news is that this can be accomplished with currently available technology, and can be done in an economically efficient manner.

Electrification not only significantly lowers greenhouse gas emissions, but also is a powerful energy efficiency measure. So even though our detailed Island energy model indicates that eliminating all (or almost all) fossil fuel use will mean our electricity use will more than double, posing challenges for state power grids in some regions, our overall annual energy consumption will be significantly lower.

So what do we specifically need to do?

The primary targets for electrification are transportation (roughly 60 peer cent of current fossil fuel use on Martha’s Vineyard) and building heating and cooling (40 per cent).

Over the past two years, the increase in the number of electric vehicle models available across a wide range of price points has been remarkable — sedans, SUVs, crossovers, pickup trucks, even transit vans. When rebates and tax credits are considered, they are affordable. Range anxiety is being addressed both by increases in vehicle performance and the growing availability of charging locations (other than at home, which will be the predominant place for Islanders to refuel) and, over time, enable vehicle-to-grid support for our local system. An EV purchase should be something everyone should seriously consider when replacing a current fossil vehicle.

The elephant in the transportation sector room is the Steamship Authority. The SSA today uses roughly 10 per cent of the fossil fuel attributable to Martha’s Vineyard, largely but not totally in the ferries. The technology needed for fully electric short-haul vessels has been under development in Scandinavia for a number of years and fully electric ferries are in operation there. A conservative approach for the SSA would be to design new boats to be hybrid diesel-electric, retrofittable to plug-in hybrids to allow for shoreside charging infrastructure to be planned and deployed. Plug-in hybrid propulsion could result in a significant reduction in emissions — perhaps as much as 95 per cent, per the long-range plan for the Washington State ferries. While the SSA has contracted for an alternative fuel study for its next boat, given the long life of the vessels, an electrification master plan is needed soon.

For building heating and cooling, the answer for electrification is heat pumps, both for new construction and retrofits. These devices move heat from outside to inside (in the winter) or inside to outside (summer), and are increasingly integrated into connected home energy systems for smarter control. They are also remarkably efficient (at least three times more efficient than burning oil or propane), and today’s technology allows their operation even in sub-zero outside temperatures. Energy costs for electric heating via heat pumps on the Vineyard are significantly below either oil or propane, and up-front costs are comparable for new construction. For new construction and when replacing an existing system, heat pumps are the smart choice, and air conditioning for the increasingly hot summers comes with the package.

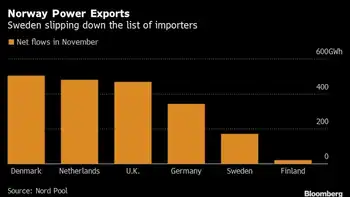
A frequent objection to electrification is that fossil-fueled generation emits greenhouse gases — thus a so-called green grid is required in order to meet our targets. The renewable energy fraction of our grid-supplied electricity is today about 30 per cent; by 2030, under current legislation that fraction will reach 54 per cent, and by 2040, 77 per cent. Proposed legislation will bring us even closer to our 2040 goals. The Vineyard Wind project will strongly contribute to the greening of our electricity supply, and our local solar generation (almost 10 per cent of our overall electricity use at this point) is non-negligible.

A final important facet of our energy system transformation is resilience. We are dependent today on our electricity supply, and this dependence will grow. As we navigate the challenges of climate change, with increasingly more frequent and more serious storms, 2021 electricity lessons underscore that resilience of electricity supply is of paramount importance. In many ways, today’s electricity distribution system is basically the same approach developed by Edison in the late 19th century. In partnership with our electric utility, we need to modernize the grid to achieve our resiliency goals.

While the full scope of this modernization effort is still being developed, the outline is clear. First, we need to increase the amount of energy generated on-Island — to perhaps 25 per cent of our total electricity use. This will be via distributed energy resources (in the form of distributed solar and battery installations as well as community solar projects) and the application of advanced grid control systems. For emergency critical needs, the concept of local microgrids that are detachable from the main grid when that grid suffers an outage are an approach that is technically sound and being deployed elsewhere. Grid coordination of distributed resources by the utility allows for handling of peak power demand; in the early 2030s this could result in what is known as a virtual power plant on the Island.

The adoption of the 100 renewable Martha’s Vineyard warrant articles is an important milestone for our community. While the global and national efforts in the climate crisis may sometimes seem fraught, we can take some considerable pride in what we have accomplished so far and will accomplish in coming years. As with many change efforts, the old catch-phrase applies: think globally, act locally.


Related News

View more

COVID-19: Daily electricity demand dips 15% globally, says report

COVID-19 Impact on Electricity Demand, per IEA data, shows 15% global load drop from lockdowns, with residential use up, industrial and service sectors down; fossil fuel generation fell as renewables and photovoltaics gained share.


Key Points

An overview of how lockdowns cut global power demand, boosted residential use, and increased the renewable share.

✅ IEA review shows at least 15% dip in daily global electricity load

✅ Lockdowns cut commercial and industrial demand; homes used more

✅ Fossil fuels fell as renewables and PV generation gained share


The daily demand for electricity dipped at least 15 per cent across the globe, according to Global Energy Review 2020: The impacts of the COVID-19 crisis on global energy demand and CO2 emissions, a report published by the International Energy Agency (IEA) in April 2020, even as global power demand surged above pre-pandemic levels.

The report collated data from 30 countries, including India and China, that showed partial and full lockdown measures adopted by them were responsible for this decrease.

Full lockdowns in countries — including France, Italy, India, Spain, the United Kingdom where daily demand fell about 10% and the midwest region of the United States (US) — reduced this demand for electricity.


Reduction in electricity demand after lockdown measures (weather corrected)


Source: Global Energy Review 2020: The impacts of the COVID-19 crisis on global energy demand and CO2 emissions, IEA


Drivers of the fall

There was, however, a spike in residential demand for electricity as a result of people staying and working from home. This increase in residential demand, though, was not enough to compensate for reduced demand from industrial and commercial operations.

The extent of reduction depended not only on the duration and stringency of the lockdown, but also on the nature of the economy of the countries — predominantly service- or industry-based — the IEA report said.

A higher decline in electricity demand was noted in countries where the service sector — including retail, hospitality, education, tourism — was dominant, compared to countries that had industrial economies.

The US, for example — where industry forms only 20 per cent of the economy — saw larger reductions in electricity demand, compared to China, where power demand dropped as the industry accounts for more than 60 per cent of the economy.

Italy — the worst-affected country from COVID-19 — saw a decline greater than 25 per cent when compared to figures from last year, even as power demand held firm in parts of Europe during later lockdowns.

The report said the shutting down of the hospitality and tourism sectors in the country — major components of the Italian economy — were said to have had a higher impact, than any other factor, for this fall.


Reduced fossil fuel dependency

Almost all of the reduction in demand was reportedly because of the shutting down of fossil fuel-based power generation, according to the report. Instead, the share of electricity supply from renewables in the entire portfolio of energy sources, increased during the pandemic, reflecting low-carbon electricity lessons observed during COVID-19.

This was due to a natural increase in wind and photovoltaic power generation compared to 2019 along with a drop in overall electricity demand that forced electricity producers from non-renewable sources to decrease their supplies, before surging electricity demand began to strain power systems worldwide.

The Power System Operation Corporation of India also reported that electricity production from coal — India’s primary source of electricity — fell by 32.2 per cent to 1.91 billion units (kilowatt-hours) per day, in line with India's electricity demand decline reported during the pandemic, compared to the 2019 levels.


Related News

View more

The Evolution of Electric Vehicle Charging Infrastructure in the US

US EV Charging Infrastructure is evolving with interoperable NACS and CCS standards, Tesla Supercharger access, federal funding, ultra-fast charging, mobile apps, and battery advances that reduce range anxiety and expand reliable, nationwide fast-charging access.


Key Points

Nationwide network, standards, and funding enabling fast, interoperable EV charging access for drivers across the US.

✅ NACS and CCS interoperability expands cross-network access

✅ Tesla Superchargers opening to more brands accelerate adoption

✅ Federal funding builds fast chargers along highways and communities


The landscape of electric vehicle (EV) charging infrastructure in the United States is rapidly evolving, driven by technological advancements, collaborative efforts between automakers and charging networks across the country, and government initiatives to support sustainable transportation.

Interoperability and Collaboration

Recent developments highlight a shift towards interoperability among charging networks, even as control over charging continues to be contested across the market today. The introduction of the North American Charging Standard (NACS) and the adoption of the Combined Charging System (CCS) by major automakers underscore efforts to standardize charging protocols. This move aims to enhance convenience for EV drivers by allowing them to use multiple charging networks seamlessly.

Tesla's Role and Expansion

Tesla, a trailblazer in the EV industry, has expanded its Supercharger network to accommodate other EV brands. This initiative represents a significant step towards inclusivity, addressing range anxiety and supporting the broader adoption of electric vehicles. Tesla's expansive network of fast-charging stations across the US continues to play a pivotal role in shaping the EV charging landscape.

Government Support and Infrastructure Investment

The federal government's commitment to infrastructure development is crucial in advancing EV adoption. The Bipartisan Infrastructure Law allocates substantial funding for EV charging station deployment along highways and in underserved communities, while automakers plan 30,000 chargers to complement public investment today. These investments aim to expand access to charging infrastructure, promote economic growth, and reduce greenhouse gas emissions associated with transportation.

Technological Advancements and User Experience

Technological innovations in EV charging, including energy storage and mobile charging solutions, continue to improve user experience and efficiency. Ultra-fast charging capabilities, coupled with user-friendly interfaces and mobile apps, simplify the charging process for consumers. Advancements in battery technology also contribute to faster charging times and increased vehicle range, enhancing the practicality and appeal of electric vehicles.

Challenges and Future Outlook

Despite progress, challenges remain in scaling EV charging infrastructure to meet growing demand. Issues such as grid capacity constraints are coming into sharp focus, alongside permitting processes and funding barriers that necessitate continued collaboration between stakeholders. Addressing these challenges is crucial in supporting the transition to sustainable transportation and achieving national climate goals.

Conclusion

The evolution of EV charging infrastructure in the United States reflects a transformative shift towards sustainable mobility solutions. Through interoperability, government support, technological innovation, and industry collaboration, stakeholders are paving the way for a robust and accessible charging ecosystem. As investments and innovations continue to shape the landscape, and amid surging U.S. EV sales across 2024, the trajectory of EV infrastructure development promises to accelerate, ensuring reliable and widespread access to charging solutions that support a cleaner and greener future.


Related News

View more

Which of the cleaner states imports dirty electricity?

Hourly Electricity Emissions Tracking maps grid balancing areas, embodied emissions, and imports/exports, revealing carbon intensity shifts across PJM, ERCOT, and California ISO, and clarifying renewable energy versus coal impacts on health and climate.


Key Points

An hourly method tracing generation, flows, and embodied emissions to quantify carbon intensity across US balancing areas.

✅ Hourly traces of imports/exports and generation mix

✅ Consumption-based carbon intensity by balancing area

✅ Policy insights for renewables, coal, health costs


In the United States, electricity generation accounts for nearly 30% of our carbon emissions. Some states have responded to that by setting aggressive renewable energy standards; others are hoping to see coal propped up even as its economics get worse. Complicating matters further is the fact that many regional grids are integrated, and as America goes electric the stakes grow, meaning power generated in one location may be exported and used in a different state entirely.

Tracking these electricity exports is critical for understanding how to lower our national carbon emissions. In addition, power from a dirty source like coal has health and environment impacts where it's produced, and the costs of these aren't always paid by the parties using the electricity. Unfortunately, getting reliable figures on how electricity is produced and where it's used is challenging, even for consumers trying to find where their electricity comes from in the first place, leaving some of the best estimates with a time resolution of only a month.

Now, three Stanford researchers—Jacques A. de Chalendar, John Taggart, and Sally M. Benson—have greatly improved on that standard, and they have managed to track power generation and use on an hourly basis. The researchers found that, of the 66 grid balancing areas within the United States, only three have carbon emissions equivalent to our national average, and they have found that imports and exports of electricity have both seasonal and daily changes. de Chalendar et al. discovered that the net results can be substantial, with imported electricity increasing California's emissions/power by 20%.

Hour by hour
To figure out the US energy trading landscape, the researchers obtained 2016 data for grid features called balancing areas. The continental US has 66 of these, providing much better spatial resolution on the data than the larger grid subdivisions. This doesn't cover everything—several balancing areas in Canada and Mexico are tied in to the US grid—and some of these balancing areas are much larger than others. The PJM grid, serving Pennsylvania, New Jersey, and Maryland, for example, is more than twice as large as Texas' ERCOT, in a state that produces and consumes the most electricity in the US.

Despite these limitations, it's possible to get hourly figures on how much electricity was generated, what was used to produce it, and whether it was used locally or exported to another balancing area. Information on the generating sources allowed the researchers to attach an emissions figure to each unit of electricity produced. Coal, for example, produces double the emissions of natural gas, which in turn produces more than an order of magnitude more carbon dioxide than the manufacturing of solar, wind, or hydro facilities. These figures were turned into what the authors call "embodied emissions" that can be traced to where they're eventually used.

Similar figures were also generated for sulfur dioxide and nitrogen oxides. Released by the burning of fossil fuels, these can both influence the global climate and produce local health problems.

Huge variation
The results were striking. "The consumption-based carbon intensity of electricity varies by almost an order of magnitude across the different regions in the US electricity system," the authors conclude. The low is the Bonneville Power grid region, which is largely supplied by hydropower; it has typical emissions below 100kg of carbon dioxide per megawatt-hour. The highest emissions come in the Ohio Valley Electric region, where emissions clear 900kg/MW-hr. Only three regional grids match the overall grid emissions intensity, although that includes the very large PJM (where capacity auction payouts recently fell), ERCOT, and Southern Co balancing areas.

Most of the low-emissions power that's exported comes from the Pacific Northwest's abundant hydropower, while the Rocky Mountains area exports electricity with the highest associated emissions. That leads to some striking asymmetries. Local generation in the hydro-rich Idaho Power Company has embodied emissions of only 71kg/MW-hr, while its imports, coming primarily from Rocky Mountain states, have a carbon content of 625kg/MW-hr.

The reliance on hydropower also makes the asymmetry seasonal. Local generation is highest in the spring as snow melts, but imports become a larger source outside this time of year. As solar and wind can also have pronounced seasonal shifts, similar changes will likely be seen as these become larger contributors to many of these regional grids. Similar things occur daily, as both demand and solar production (and, to a lesser extent, wind) have distinct daily profiles.

The Golden State
California's CISO provides another instructive case. Imports represent less than 30% of its total electric use in 2016, yet California electricity imports provided 40% of its embodied emissions. Some of these, however, come internally from California, provided by the Los Angeles Department of Water and Power. The state itself, however, has only had limited tracking of imported emissions, lumping many of its sources as "other," and has been exporting its energy policies to Western states in ways that shape regional markets.

Overall, the 2016 inventory provides a narrow picture of the US grid, as plenty of trends are rapidly changing our country's emissions profile, including the rise of renewables and the widespread adoption of efficiency measures and other utility trends in 2017 that continue to evolve. The method developed here can, however, allow for annual updates, providing us with a much better picture of trends. That could be quite valuable to track things like how the rapid rise in solar power is altering the daily production of clean power.

More significantly, it provides a basis for more informed policymaking. States that wish to promote low-emissions power can use the information here to either alter the source of their imports or to encourage the sites where they're produced to adopt more renewable power. And those states that are exporting electricity produced primarily through fossil fuels could ensure that the locations where the power is used pay a price that includes the health costs of its production.


Related News

View more

Sign Up for Electricity Forum’s Newsletter

Stay informed with our FREE Newsletter — get the latest news, breakthrough technologies, and expert insights, delivered straight to your inbox.

Electricity Today T&D Magazine Subscribe for FREE

Stay informed with the latest T&D policies and technologies.
  • Timely insights from industry experts
  • Practical solutions T&D engineers
  • Free access to every issue

Live Online & In-person Group Training

Advantages To Instructor-Led Training – Instructor-Led Course, Customized Training, Multiple Locations, Economical, CEU Credits, Course Discounts.

Request For Quotation

Whether you would prefer Live Online or In-Person instruction, our electrical training courses can be tailored to meet your company's specific requirements and delivered to your employees in one location or at various locations.